Entering edit mode

Hi,
I hope to try a full library size normalization but with edgeR.
So I performed the following:
data(tamoxifen_analysis)
tamoxifen = dba.normalize(tamoxifen, method = DBA_EDGER)
dba.normalize(tamoxifen, method = DBA_EDGER, bRetrieve = T)
Interestingly the normalization factors are all 1
$norm.method
[1] "lib"

$norm.factors
 [1] 1 1 1 1 1 1 1 1 1 1 1

$lib.method
[1] "full"

$lib.sizes
 [1]  652697  663370  346429  368052  466273  399879 1475415  616630  593224  706836 2575408
But apparently some normalization has happened as the ma plot is different from the one using raw data:
tamoxifen = dba.analyze(tamoxifen, method = DBA_EDGER)
dba.plotMA(tamoxifen, method = DBA_EDGER)
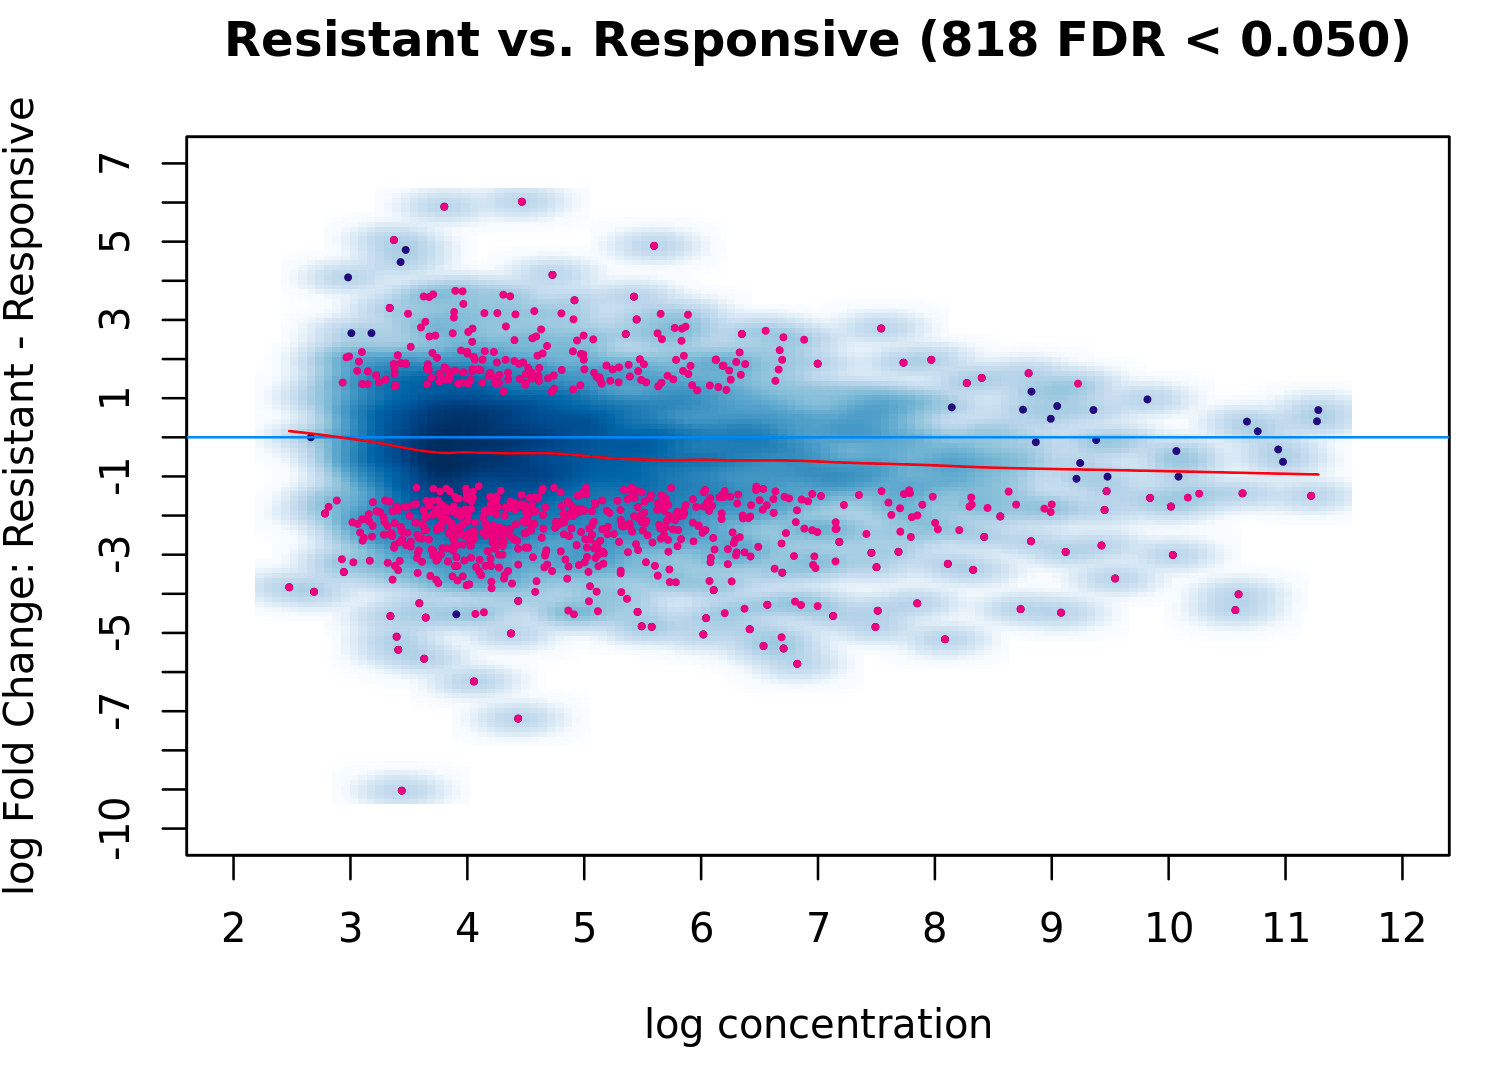
Could you please explain why is that? Thanks!

It's interesting to see how the normalization factors are all 1, yet the MA plot reflects changes, indicating that the normalization process is still influencing the data! @retro bowl college