Unfortunately you did not show how you generated your input data (the object enrichment), nor did you show the output from sessionInfo().
To me it seems you are using an old version of R/Bioconductor.
Anyway, using the current version of Bioconductor with the example dataset:
> library(clusterProfiler)
> library(org.Hs.eg.db)
> library(enrichplot)
>
>
> ## example list of genes
> data(geneList, package="DOSE")
> genes <- names(geneList)[abs(geneList) > 2]
>
> res <- enrichKEGG(gene = genes,
+                   organism = "hsa",
+                   keyType = "kegg",
+                   pvalueCutoff = 0.05,
+                   pAdjustMethod = "BH",
+                   minGSSize = 10,
+                   maxGSSize = 500)
>
> ## to increase readability, convert entrezid into symbols
> ## also calculate pairwise similarities (is in essence only applicable
> ## to GO terms, but just to be sure
>
> res <- setReadable(res, OrgDb = org.Hs.eg.db, keyType="ENTREZID")
> res <- pairwise_termsim(res)
>
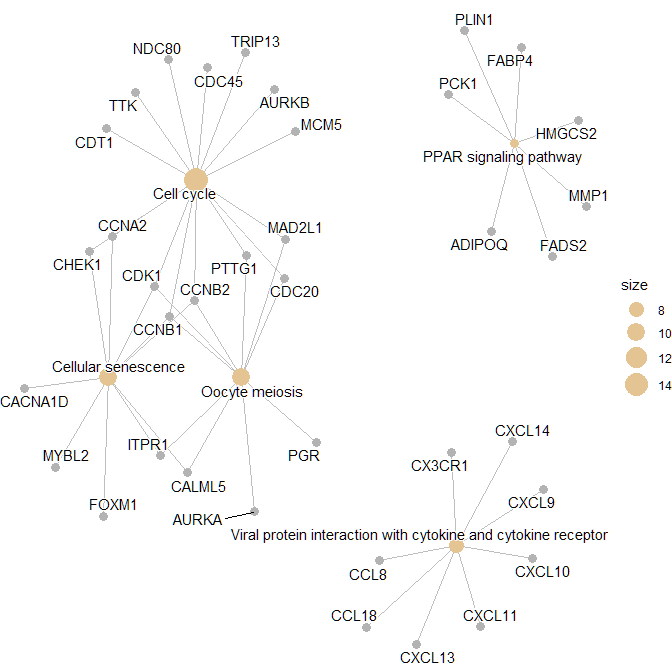
> ## cnetplot
> p1 <- cnetplot(
+                res,
+                layout = igraph::layout_with_kk,
+                showCategory = 5,
+                color_category = "#E5C494",
+                size_category = 1,
+                color_item = "#B3B3B3",
+                size_item = 1,
+                color_edge = "grey",
+                size_edge = 0.5,
+                node_label = "all",
+                foldChange = NULL,
+                hilight_alpha = 0.3,
+                 )
>
> print(p1)
>

> packageVersion("clusterProfiler")
[1] '4.14.6'
> packageVersion("enrichplot")
[1] '1.26.6'
>
>
>
> BiocManager::version()
 [1] '3.20'
>
> sessionInfo()
R version 4.4.2 (2024-10-31 ucrt)
Platform: x86_64-w64-mingw32/x64
Running under: Windows 10 x64 (build 19042)

Matrix products: default


locale:
[1] LC_COLLATE=English_United States.utf8
[2] LC_CTYPE=English_United States.utf8
[3] LC_MONETARY=English_United States.utf8
[4] LC_NUMERIC=C
[5] LC_TIME=English_United States.utf8

time zone: Europe/Amsterdam
tzcode source: internal

attached base packages:
[1] stats4    stats     graphics  grDevices utils     datasets  methods
[8] base

other attached packages:
[1] enrichplot_1.26.6      clusterProfiler_4.14.6 org.Hs.eg.db_3.20.0
[4] AnnotationDbi_1.68.0   IRanges_2.40.1         S4Vectors_0.44.0
[7] Biobase_2.66.0         BiocGenerics_0.52.0

loaded via a namespace (and not attached):
 [1] tidyselect_1.2.1        dplyr_1.1.4             farver_2.1.2
 [4] blob_1.2.4              R.utils_2.13.0          Biostrings_2.74.1
 [7] lazyeval_0.2.2          fastmap_1.2.0           digest_0.6.37
[10] lifecycle_1.0.4         KEGGREST_1.46.0         tidytree_0.4.6
[13] RSQLite_2.3.9           magrittr_2.0.3          compiler_4.4.2
[16] rlang_1.1.5             tools_4.4.2             igraph_2.1.4
[19] data.table_1.17.0       ggtangle_0.0.6          labeling_0.4.3
[22] bit_4.6.0               gson_0.1.0              plyr_1.8.9
[25] RColorBrewer_1.1-3      aplot_0.2.5             BiocParallel_1.40.0
[28] withr_3.0.2             purrr_1.0.4             R.oo_1.27.0
[31] grid_4.4.2              GOSemSim_2.32.0         colorspace_2.1-1
[34] GO.db_3.20.0            ggplot2_3.5.1           scales_1.3.0
[37] cli_3.6.4               crayon_1.5.3            treeio_1.30.0
[40] generics_0.1.3          ggtree_3.14.0           httr_1.4.7
[43] reshape2_1.4.4          DBI_1.2.3               qvalue_2.38.0
[46] ape_5.8-1               cachem_1.1.0            DOSE_4.0.0
[49] stringr_1.5.1           zlibbioc_1.52.0         splines_4.4.2
[52] parallel_4.4.2          ggplotify_0.1.2         XVector_0.46.0
[55] yulab.utils_0.2.0       vctrs_0.6.5             Matrix_1.7-3
[58] jsonlite_1.9.1          gridGraphics_0.5-1      patchwork_1.3.0
[61] bit64_4.6.0-1           ggrepel_0.9.6           tidyr_1.3.1
[64] glue_1.8.0              codetools_0.2-20        cowplot_1.1.3
[67] stringi_1.8.4           gtable_0.3.6            GenomeInfoDb_1.42.3
[70] UCSC.utils_1.2.0        munsell_0.5.1           tibble_3.2.1
[73] pillar_1.10.1           fgsea_1.32.4            GenomeInfoDbData_1.2.13
[76] R6_2.6.1                lattice_0.22-6          R.methodsS3_1.8.2
[79] png_0.1-8               memoise_2.0.1           ggfun_0.1.8
[82] Rcpp_1.0.14             fastmatch_1.1-6         nlme_3.1-167
[85] fs_1.6.5                pkgconfig_2.0.3
>


