Error in cnetplot
1
0
Entering edit mode
Ayesha • 0
@01866be1
Last seen 5 days ago
United States

Enter the body of text here I am trying to make a cnetplot for my data. Input is an enrichResult obj. I am following the instructions for Cnetplot for rnrichResult obj given in the manual of enrichplot package but still getting this error. Can someone please help me with that? Code should be placed in three backticks as shown below


# include your problematic code here with any corresponding output 
library(clusterProfiler)
library(org.Mm.eg.db)
library(biomaRt)
library(GOSemSim)
library(readr)
library(enrichplot)
library(DOSE)

cnetplot(
+   enrichment,
+   layout = igraph::layout_with_kk,
+   showCategory = 5,
+   color_category = "#E5C494",
+   size_category = 1,
+   color_item = "#B3B3B3",
+   size_item = 1,
+   color_edge = "grey",
+   size_edge = 0.5,
+   node_label = "all",
+   foldChange = NULL,
+   hilight_alpha = 0.3,
+ )


sessionInfo( )
Error in graph_from_data_frame(d = d, directed = directed, vertices = vertices) : 
  the data frame should contain at least two columns
In addition: Warning messages:
1: In cnetplot.enrichResult(x, ...) :
  Use 'color.params = list(foldChange = your_value)' instead of 'foldChange'.
 The foldChange parameter will be removed in the next version.
2: In cnetplot.enrichResult(x, ...) :
  Use 'color.params = list(edge = your_value)' instead of 'colorEdge'.
 The colorEdge parameter will be removed in the next version.
3: In cnetplot.enrichResult(x, ...) :
  Use 'color.params = list(category = your_value)' instead of 'color_category'.
 The color_category parameter will be removed in the next version.
# please also include the results of running the following in an R session
enrichplot clusterProfiler • 127 views
ADD COMMENT
0
Entering edit mode
Guido Hooiveld ★ 4.1k
@guido-hooiveld-2020
Last seen 22 hours ago
Wageningen University, Wageningen, the …

Unfortunately you did not show how you generated your input data (the object enrichment), nor did you show the output from sessionInfo(). To me it seems you are using an old version of R/Bioconductor.

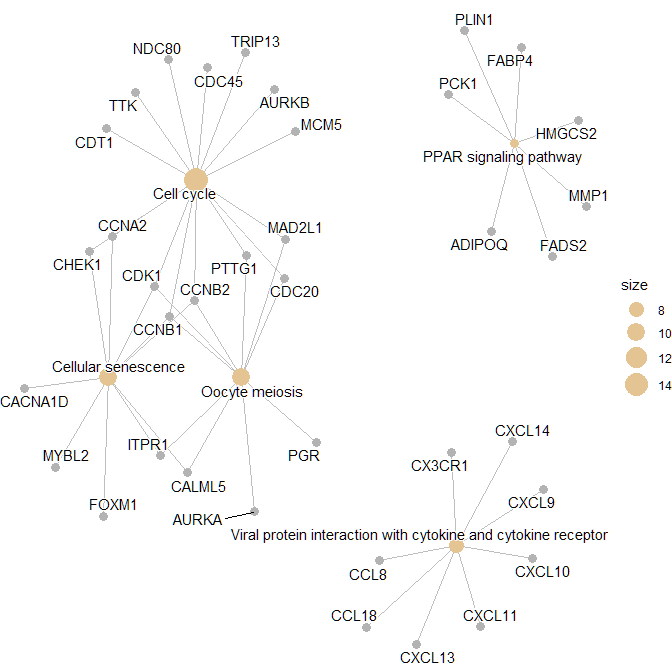
Anyway, using the current version of Bioconductor with the example dataset:

> library(clusterProfiler)
> library(org.Hs.eg.db)
> library(enrichplot)
> 
> 
> ## example list of genes
> data(geneList, package="DOSE")
> genes <- names(geneList)[abs(geneList) > 2]
> 
> res <- enrichKEGG(gene = genes,
+                   organism = "hsa",
+                   keyType = "kegg",
+                   pvalueCutoff = 0.05,
+                   pAdjustMethod = "BH",
+                   minGSSize = 10,
+                   maxGSSize = 500)
> 
> ## to increase readability, convert entrezid into symbols
> ## also calculate pairwise similarities (is in essence only applicable
> ## to GO terms, but just to be sure
>  
> res <- setReadable(res, OrgDb = org.Hs.eg.db, keyType="ENTREZID")
> res <- pairwise_termsim(res)
> 
> ## cnetplot
> p1 <- cnetplot(
+                res,
+                layout = igraph::layout_with_kk,
+                showCategory = 5,
+                color_category = "#E5C494",
+                size_category = 1,
+                color_item = "#B3B3B3",
+                size_item = 1,
+                color_edge = "grey",
+                size_edge = 0.5,
+                node_label = "all",
+                foldChange = NULL,
+                hilight_alpha = 0.3,
+                 )
> 
> print(p1)
> 

enter image description here

> packageVersion("clusterProfiler") 
[1] '4.14.6'
> packageVersion("enrichplot")
[1] '1.26.6'
> 
> 
>
> BiocManager::version()
 [1] '3.20'
> 
> sessionInfo()
R version 4.4.2 (2024-10-31 ucrt)
Platform: x86_64-w64-mingw32/x64
Running under: Windows 10 x64 (build 19042)

Matrix products: default


locale:
[1] LC_COLLATE=English_United States.utf8 
[2] LC_CTYPE=English_United States.utf8   
[3] LC_MONETARY=English_United States.utf8
[4] LC_NUMERIC=C                          
[5] LC_TIME=English_United States.utf8    

time zone: Europe/Amsterdam
tzcode source: internal

attached base packages:
[1] stats4    stats     graphics  grDevices utils     datasets  methods  
[8] base     

other attached packages:
[1] enrichplot_1.26.6      clusterProfiler_4.14.6 org.Hs.eg.db_3.20.0   
[4] AnnotationDbi_1.68.0   IRanges_2.40.1         S4Vectors_0.44.0      
[7] Biobase_2.66.0         BiocGenerics_0.52.0   

loaded via a namespace (and not attached):
 [1] tidyselect_1.2.1        dplyr_1.1.4             farver_2.1.2           
 [4] blob_1.2.4              R.utils_2.13.0          Biostrings_2.74.1      
 [7] lazyeval_0.2.2          fastmap_1.2.0           digest_0.6.37          
[10] lifecycle_1.0.4         KEGGREST_1.46.0         tidytree_0.4.6         
[13] RSQLite_2.3.9           magrittr_2.0.3          compiler_4.4.2         
[16] rlang_1.1.5             tools_4.4.2             igraph_2.1.4           
[19] data.table_1.17.0       ggtangle_0.0.6          labeling_0.4.3         
[22] bit_4.6.0               gson_0.1.0              plyr_1.8.9             
[25] RColorBrewer_1.1-3      aplot_0.2.5             BiocParallel_1.40.0    
[28] withr_3.0.2             purrr_1.0.4             R.oo_1.27.0            
[31] grid_4.4.2              GOSemSim_2.32.0         colorspace_2.1-1       
[34] GO.db_3.20.0            ggplot2_3.5.1           scales_1.3.0           
[37] cli_3.6.4               crayon_1.5.3            treeio_1.30.0          
[40] generics_0.1.3          ggtree_3.14.0           httr_1.4.7             
[43] reshape2_1.4.4          DBI_1.2.3               qvalue_2.38.0          
[46] ape_5.8-1               cachem_1.1.0            DOSE_4.0.0             
[49] stringr_1.5.1           zlibbioc_1.52.0         splines_4.4.2          
[52] parallel_4.4.2          ggplotify_0.1.2         XVector_0.46.0         
[55] yulab.utils_0.2.0       vctrs_0.6.5             Matrix_1.7-3           
[58] jsonlite_1.9.1          gridGraphics_0.5-1      patchwork_1.3.0        
[61] bit64_4.6.0-1           ggrepel_0.9.6           tidyr_1.3.1            
[64] glue_1.8.0              codetools_0.2-20        cowplot_1.1.3          
[67] stringi_1.8.4           gtable_0.3.6            GenomeInfoDb_1.42.3    
[70] UCSC.utils_1.2.0        munsell_0.5.1           tibble_3.2.1           
[73] pillar_1.10.1           fgsea_1.32.4            GenomeInfoDbData_1.2.13
[76] R6_2.6.1                lattice_0.22-6          R.methodsS3_1.8.2      
[79] png_0.1-8               memoise_2.0.1           ggfun_0.1.8            
[82] Rcpp_1.0.14             fastmatch_1.1-6         nlme_3.1-167           
[85] fs_1.6.5                pkgconfig_2.0.3        
> 
ADD COMMENT

Login before adding your answer.

Traffic: 866 users visited in the last hour
Help About
FAQ
Access RSS
API
Stats

Use of this site constitutes acceptance of our User Agreement and Privacy Policy.

Powered by the version 2.3.6