
Hi everyone,
We analysed gene expression in 2 neighbouring tissues (VENTRAL and DORSAL) from 2 independent individuals: 3 cell populations were sorted from each tissue followed by bulk RNAseq: TISSUE 1. Individual 1: V_VC_1; V_VC_CD45_1; V_CD45_1 Individual 2: V_VC_2; V_VC_CD45_2; V_VC_CD45_2 TISSUE 2. Individual 1: D_VC_1; D_VC_CD45_1; D_CD45_1 Individual 2: D_VC_2; D_VC_CD45_2; D_VC_CD45_2
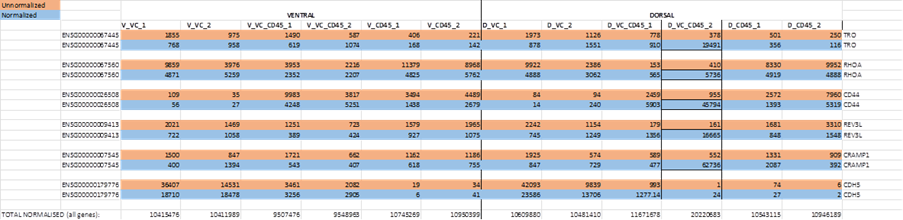
The dataset was normalised but showed enormous discrepancies with unnormalized reads for some (but not all) genes in population DP2 (for simplicity, selection of 5 genes which showed this abnormality shown below). Nothing like that is seen by eye in other columns. We noticed that total reads for all genes after normalisation for D_VC_CD45_2 was 2-fold higher than for ; D_VC_CD45_1, whereas total reads for each other cell population in individuals 1 and 2 were similar (shown at the bottom of Table).
I would be grateful if you could suggest what might cause the problem, if indeed it is a problem.
meta <- structure(list(rowname = c("V_VC_1", "V_VC_CD45_1", "D_VC_1",
"D_VC_CD45_1", "V_CD45_1", "D_CD45_1", "V_VC_2", "V_VC_CD45_2",
"V_CD45_2", "D_VC_2", "D_VC_CD45_2", "D_CD45_2"), rep = c("1",
"1", "1", "1", "1", "1", "2", "2", "2", "2", "2", "2"), group = c("V_VC",
"V_VC_CD45", "D_VC", "D_VC_CD45", "V_CD45", "D_CD45", "V_VC",
"V_VC_CD45", "V_CD45", "D_VC", "D_VC_CD45", "D_CD45")), row.names = c(NA,
-12L), class = "data.frame")

dds <- DESeqDataSetFromTximport(txi, colData = meta,
                                             design = ~Rep + Group,
                                             rowData = rowdata)

keep <- filterByExpr(dds, group = dds$Group)
dds <- dds[keep,]

dds <- estimateSizeFactors(dds)

deseq <- DESeq(dds)

counts <- counts(dds, normalized = TRUE)
unnorm_counts <- counts(dds, normalized = FALSE)
Thank you in advance
Please show examples using
plotCounts(). Custom spreadsheets harbor the risk of parsing errors along the way which very often explains what users think is a software error. Per sample all counts are scaled by the same size factor so I strongly assume that something was parsed here incorrectly.Thank you for your reply.
I thought with tximport it would be per sample/ per gene?
Here are the count plots for one example CD44:
normalised:
unnormalised:
Do you have a very wide discrepancy in total counts between samples?
Thank you for your reply! There are some pretty big discrepancies in the total raw counts between samples:
structure(list(colSums.unnorm_count. = c(21906602, 16609269, 22388224, 5340472, 22932621, 18002546, 9164400, 7373842, 18073886, 6200421, 759821, 20148983)), class = "data.frame", row.names = c("V_VC_1", "V_VC_CD45_1", "D_VC_1", "D_VC_CD45_1", "V_CD45_1", "D_CD45_1", "V_VC_2", "V_VC_CD45_2", "V_CD45_2", "D_VC_2", "D_VC_CD45_2", "D_CD45_2"))
Well, that's going to make each sample normalize quite differently. So you should expect large difference between normalized and unnormalized. You have a more than 10x fold difference between your lowest and highest samples. That's a lot. Honestly, the assumptions underlying the usual normalization algorithm might not hold in your samples.
Thank you for your explanation, that makes sense. Do you have any suggestions on how to deal with this issue? if it is an issue? especially for the samples D_VC_CD45_1 and D_VC_CD45_2.