Entering edit mode

I am trying to produce a heatmap to represent a contrast I performed on my deseq object. We have a relatively big experiment where samples are individual Drosophila in 10 different conditions. I am managing to produce the heatmap, but I am not managing to add the 2 levels of the conditions compared in my contrast on top of the heatmap as an annotation :
resIHW5_tidy<- results(dds, contrast=c("condition","F6","F0"), filterFun = ihw,alpha=0.05, lfcThreshold=1, altHypothesis="greaterAbs", tidy=TRUE)
df_IHW5<- as.data.frame(resIHW5_tidy)
IHW5_sign = subset(df_IHW5, padj<=0.05)
rownames(IHW5_sign)=IHW5_sign$row ## now the row is the FlyBase accession number

# I rearranged the table to get the genes reordered by log2 fold change :
res_log2FC <- arrange(IHW5_sign, desc(IHW5_sign$log2FoldChange))
# I created a vector of the gene accession numbers
genes <- res_log2FC$row
genes <- factor(genes, levels=genes)
1765 Levels: FBgn0000356 FBgn0052644 FBgn0031621 FBgn0000644 ... FBgn0036600

gene_names<-as.factor(res_log2FC$name) # a vector containing the gene names that I assigned to the accession numbers, but the problem is that there are several accession numbers with the same gene name so instead

# So instead I added an other column in IHW5_sign which consists in a concatenation of the accession number and gene name and made it a factor :
genes_names<-paste(genes,"-",gene_names)
genes_names
[1763] "FBgn0051091 - uncharacterized protein"
[1764] "FBgn0005633 - flightin"
[1765] "FBgn0036600 - uncharacterized protein"

genes_names<-factor(genes_names)

# I transformed my deseq object :
vsd<-vst(dds,blind=FALSE)

colData names(10): library sample ... host-treat condition

colData(vsd)$condition <- as.factor(colData(vsd)$condition)

# filtering out the samples that are in my 2 levels of interest (the ones compared in my contrast) only from this new dataset :
vsd_interest<-vsd[ , vsd$condition %in% c("F0", "F6") ]

# vsd_interest$condition, the output still shows me the 10 levels as factors, despite having only the 2 of them effectively represented in the new dataset. I am not sure how much of a problem this is though.

samples_interest<-colnames(vsd_interest)
samples_interest
 [1] "3"   "6"   "8"   "14"  "46"  "47"  "59"  "60"  "74"  "75"  "80"  "86"
[13] "95"  "99"  "102" "104" "116" "119" "137" "139" "143" "149" "150" "151"
[25] "172" "173" "188" "190" "195" "198" "209" "210" "211" "233" "235" "239"
[37] "242" "243" "460" "985"
# these are indeed my samples of interest in the 2 treatment levels of my contrast

#from my metadata file, called "sample_data.tsv" :
sample_data_interest<- sample_data[sample_data$condition =='F0' | sample_data$condition =='F6',]

samples<-sample_data_interest$library
samples
 [1] "3"   "6"   "8"   "14"  "46"  "47"  "59"  "60"  "74"  "75"  "80"  "86"
[13] "95"  "99"  "102" "104" "116" "119" "137" "139" "143" "149" "150" "151"
[25] "172" "173" "188" "190" "195" "198" "209" "210" "211" "233" "235" "239"
[37] "242" "243" "460" "985"
# they do match the colnames(vsd_interest)

### Now the heatmap :

pheatmap(assay(vsd_interest)[rownames(assay(vsd_interest)) %in% genes, colnames(assay(vsd_interest)) %in% samples],
    cluster_rows=F,
    cluster_cols=T,
    cellwidth = 10,cellheight=8.6,
    color=colorRampPalette(c("#f9cb9c","#a7146a"))(n = 100),
    show_colnames=T,
    show_rownames = T,
    labels_row=genes_names,
    heatmap_legend_param = list(title = "Counts",
                                direction = "horizontal",
                                title_position = "topcenter"))
Here is the top of the heatmap (because it is very very long) :
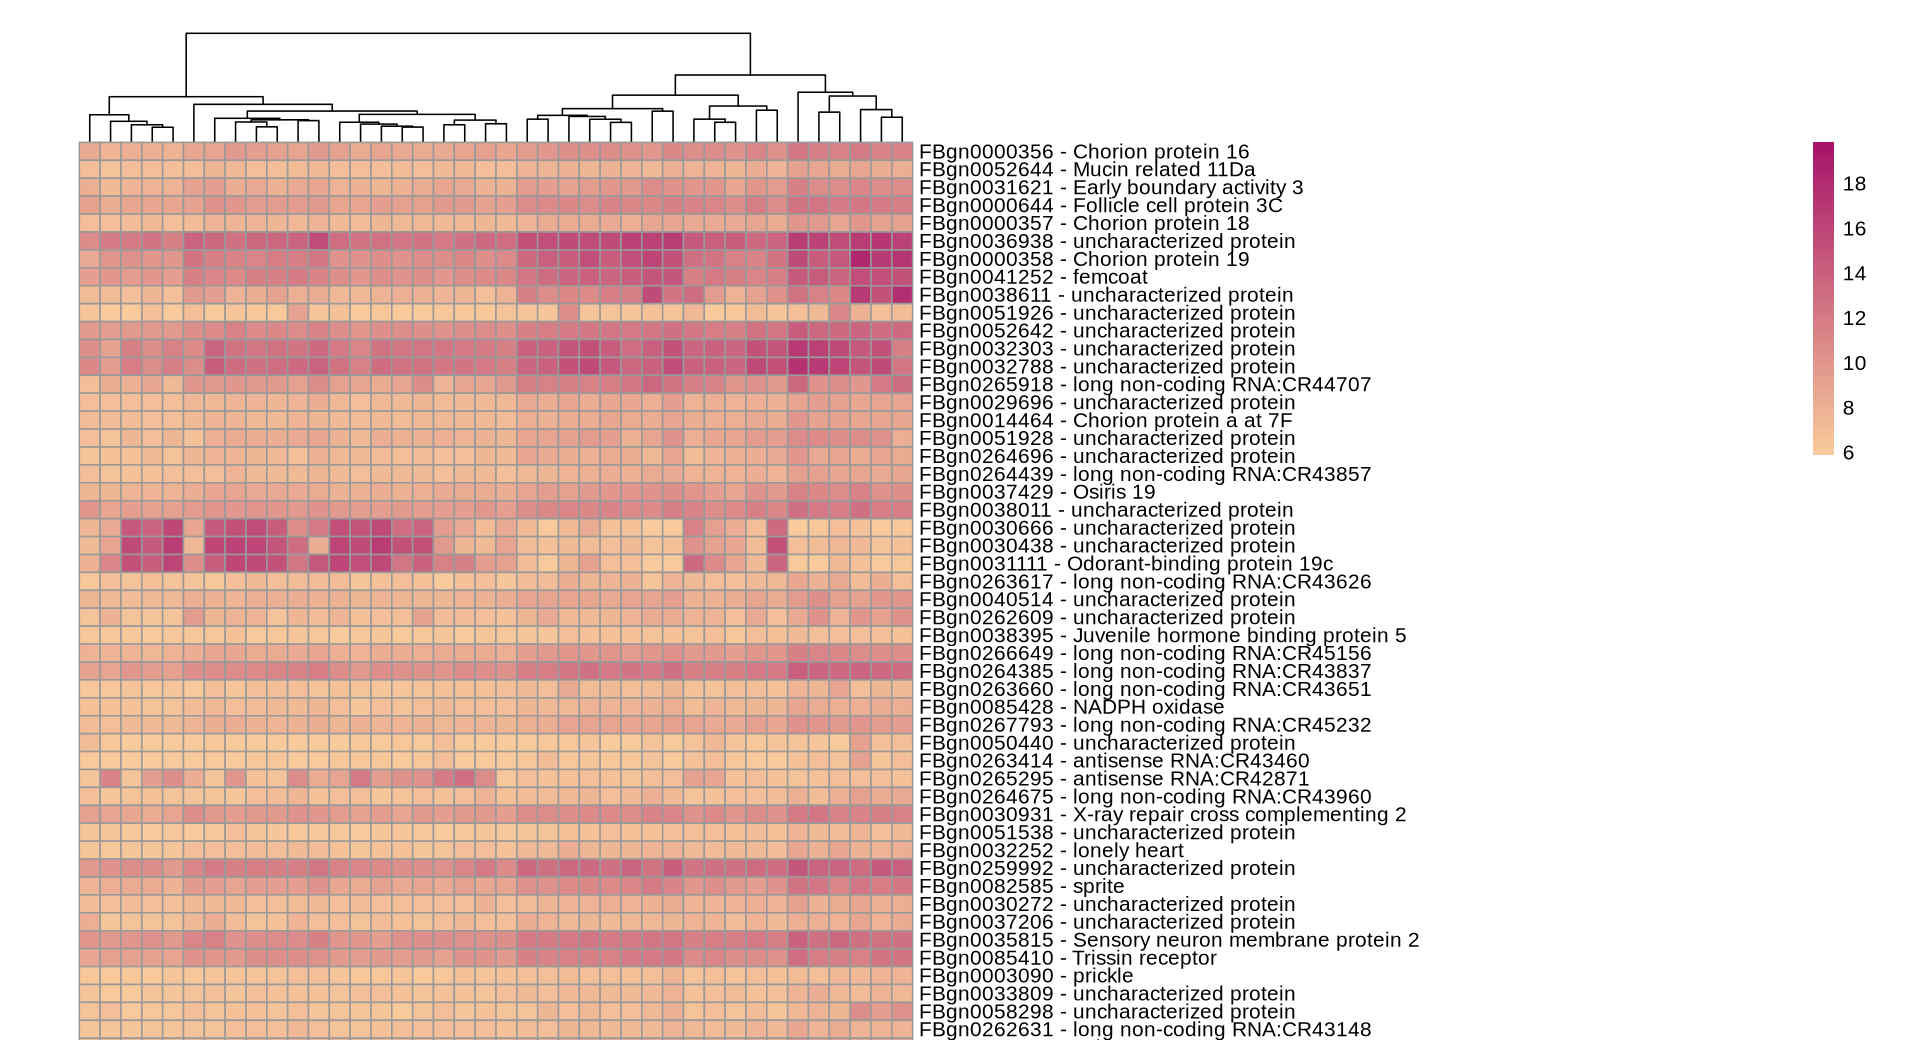
It would be perfect if I could add the levels of the condition for each sample at the very top, where the dendrogram is. I tried :
fcond<-as.factor(colData(vsd_interest)$condition)

# this still gives me the 10 levels, despite not being represented in vsd_interest since it is a subset

pheatmap(assay(vsd_interest)[rownames(assay(vsd_interest)) %in% genes, colnames(assay(vsd_interest)) %in% samples],
    cluster_rows=F,
    cluster_cols=T,
    cellwidth = 10,cellheight=8.6,
    color=colorRampPalette(c("#f9cb9c","#a7146a"))(n = 100),
    show_colnames=T, # Show the sample names
    show_rownames = T,
    labels_row=genes_names,
    annotation_col = fcond,
    heatmap_legend_param = list(title = "Counts",
                                direction = "horizontal",
                                title_position = "topcenter"))

Error in `[.default`(annotation_col, colnames(mat), , drop = F) :
  incorrect number of dimensions

# So I tried taking the condition levels from my subsetted metadata file instead :

fcond2<-as.factor(sample_data_interest$condition)

# and use this instead of fcond in the previous code, but with the same outcome.
I would really appreciate it if someone could point out the very naive mistake I am making.

You neglected to add the code you use to generate the heatmap.
It is in ! It just took longer than planned :) ... aaaand now that I added the heatmap in I realize lits of genes really do not look like they are more expressed in some samples compared to others... The p-value is significant though. Maybe I should choose alpha<0.01.