Entering edit mode

Hello ! I have a deseq object (called 'dds' here)
dds
class: DESeqDataSet
dim: 11060 198
metadata(1): version
assays(6): counts avgTxLength ... H cooks
rownames(11060): FBgn0000003 FBgn0000008 ... FBgn0288846 FBgn0288856
rowData names(66): baseMean baseVar ... deviance maxCooks
colnames(198): 1 2 ... 1291 1425
colData names(10): library sample ... condition
the 'rownames' being FlyBase accession numbers.
I am using ComplexHeatmap to make a huge heatmap of genes that are differentially expressed between 2 levels of my 'condition' factor :
resIHW5_tidy<- results(dds, contrast=c("condition","F6","F0"), filterFun = ihw,alpha=0.05, lfcThreshold=1, altHypothesis="greaterAbs", tidy=TRUE)
df_IHW5<- as.data.frame(resIHW5_tidy)
res_log2FC = subset(df_IHW5, padj<=0.05)
rownames(res_log2FC)=IHW5_sign$row ## now the row is the FlyBase accession number

# I added an extra column in res_log2FC which consists in a concatenation of the accession number and gene name :

genes <- res_log2FC$row
gene_names<-res_log2FC$name
genes_names<-paste(genes,"-",gene_names)

### I transformed the deseq object :
vsd<-vst(dds,blind=FALSE)

colData(vsd)$condition <- as.factor(colData(vsd)$condition)

# filtering out the samples that are in my 2 levels of interest (the ones compared in my contrast) from the transformed deseq object :

vsd_interest<-vsd[ , vsd$condition %in% c("F0", "F6") ]

samples_interest<-colnames(vsd_interest) # subsetting the samples that are represented in my 2 levels of interest

# I thank again the nice people who helped me [here][1] https://www.biostars.org/p/9612041/

annot_col <- data.frame(condition = factor(colData(vsd_interest)$condition))

expr_matrix <- assay(vsd_interest)[rownames(assay(vsd_interest)) %in% genes, colnames(assay(vsd_interest)) %in% samples_interest]

ref_means <- rowMeans(expr_matrix[, annot_col$condition == "F0"])
cent_expr_matrix <- expr_matrix - ref_means
cent_expr_breaks <- seq(-3, +3, length = 101)

# Then the heatmap :

ha = HeatmapAnnotation(df = annot_col, which="column",show_annotation_name = FALSE,show_legend=FALSE)

Heatmap(cent_expr_matrix, name = "Log2FC", km = 5, col = colorRamp2(c(-3, 0, +3), c("#00aba9", "white", "#ff0097")),
    top_annotation = ha, column_split=annot_col$condition, show_row_names = TRUE, show_column_names = TRUE, show_column_dend=FALSE,show_row_dend=FALSE, width = unit(0.8, "snpc"))
It gives a very long heatmap, you can see the top of it here :
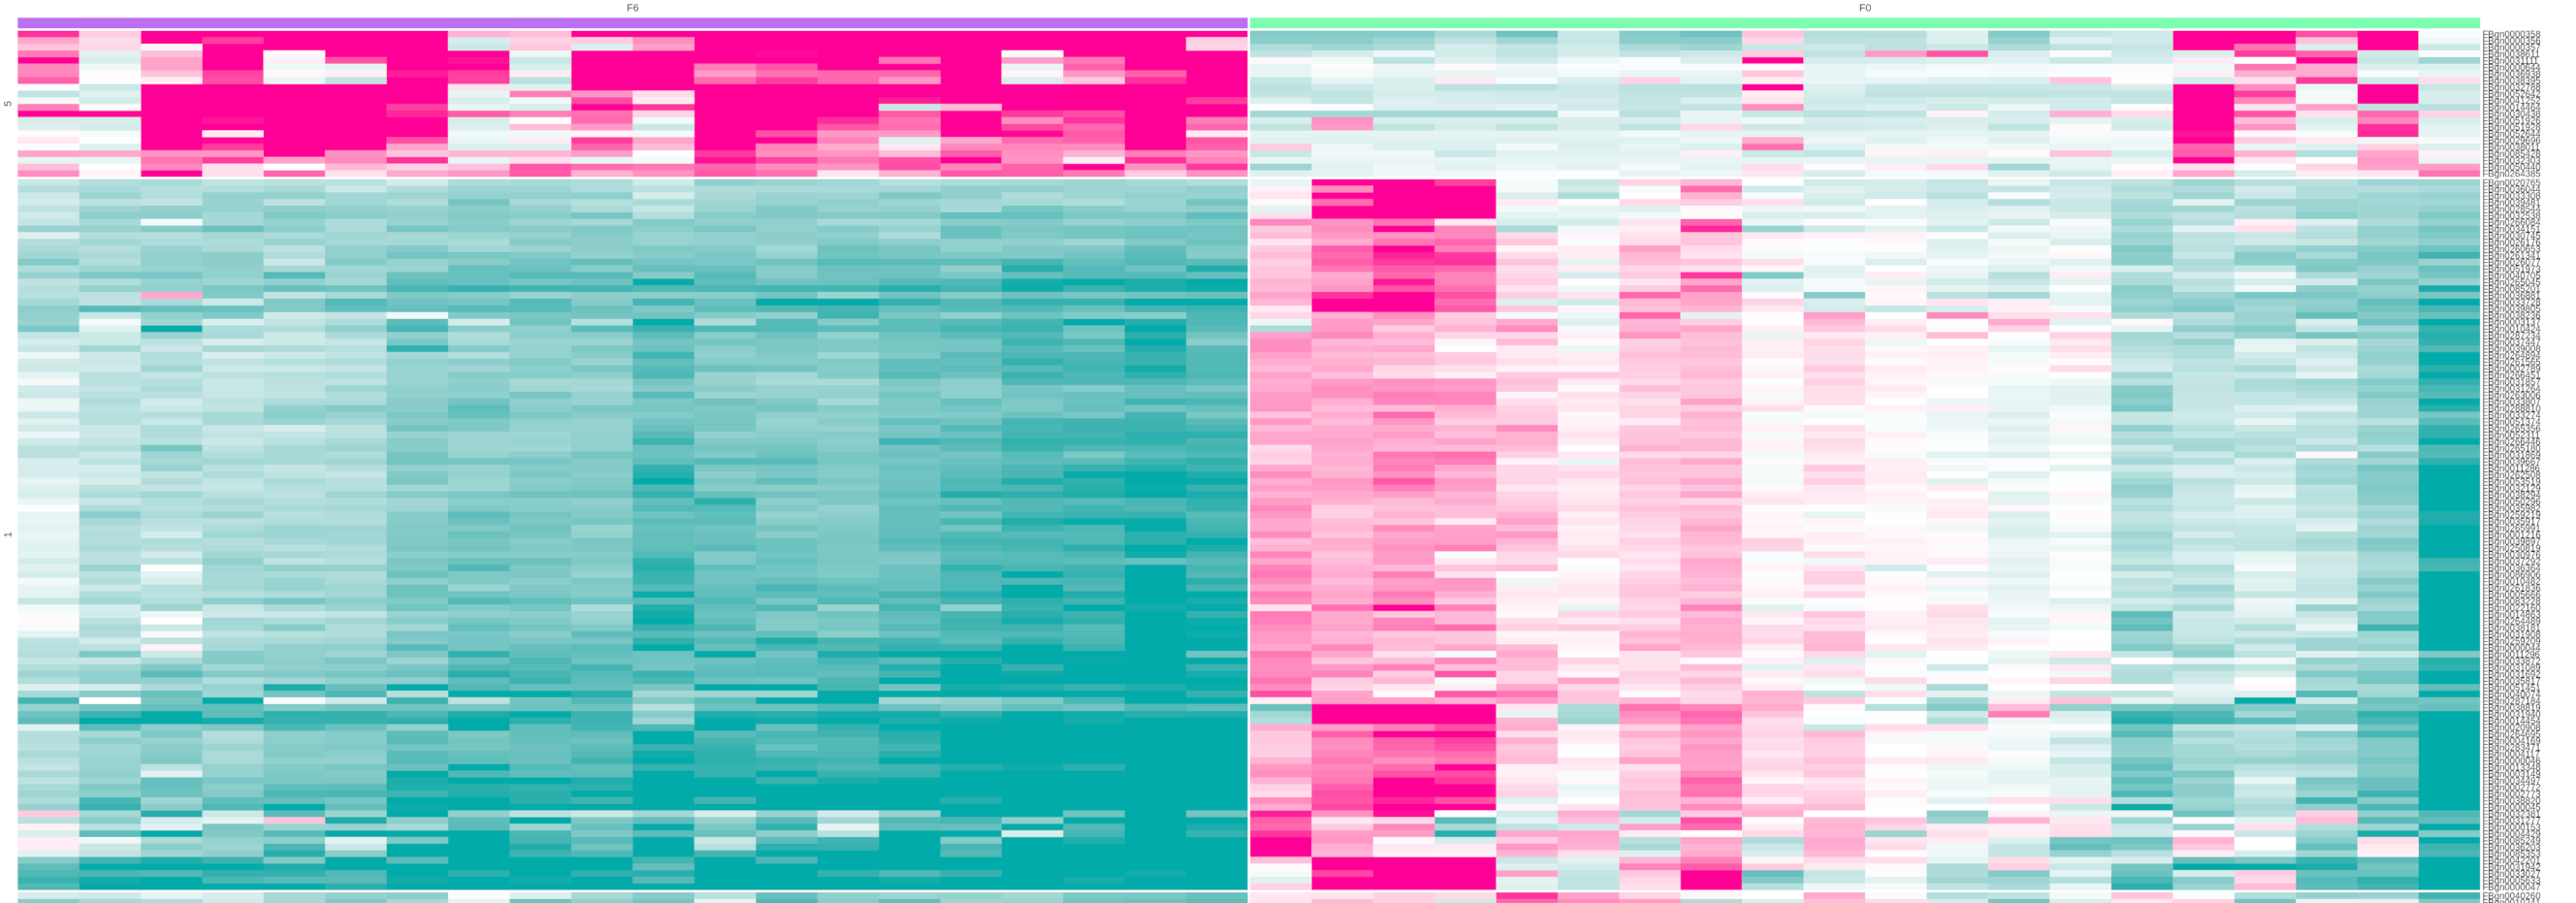
As you can see (you have to trust me cause the numbers are really small), the gene accession numbers are on the right side. I would like to add gene names as a row annotation instead. I would appreciate any help !

Thank you !
In the end I did
Would it make sense to add an annotation column of GO terms ? Or is it something that needs to be properly analysed ?
Probably not. Any given gene may be appended with many different GO terms, so you would end up with something that is not very useful.
Even if we only use the directly appended GO terms, it's too many.
The conventional thing to do is to perform some sort of test (hypergeometric, gene set test, etc) and then you might generate a heatmap that contains the genes that gave rise to one or more significant GO or KEGG terms, with annotations to indicate the genes for each term.
Yes indeed. I should probably better add an extra annotation column identifying pseudogenes. Maybe I should even filter pseudogenes out ? I will look up the test you mentioned, thank you !