
sig_lumbar<- subset(res_lumbar, padj < 0.1 & abs(log2FoldChange) >= 1)
up_lumbar <- subset(sig_lumbar, log2FoldChange >= 1)
down_lumbar<- subset(sig_lumbar, log2FoldChange <= -1)
cat("Lumbar Upregulated:", nrow(up_lumbar), "\n")
cat("Lumbar Downregulated:", nrow(down_lumbar), "\n")
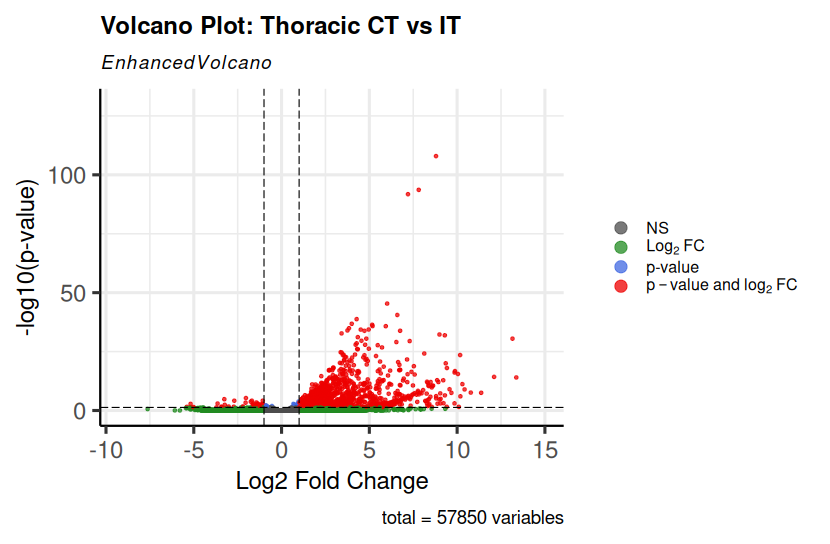
EnhancedVolcano(res_lumbar, lab = NA, x = "log2FoldChange", y = "padj", title = "Volcano Plot: Thoracic CT vs IT", xlab = "Log2 Fold Change", ylab = "-log10(p-value)", pCutoff = 0.05, FCcutoff = 1, pointSize = 1, colAlpha = 0.75, legendPosition = "right", legendLabSize = 12, legendIconSize = 4, drawConnectors = FALSE, ylim=c(0,130) ) This is the code i have used. While plotting the Volcano plots, due to few outliers, my whole plot is getting skewed, can anyone please suggest me how to include nreaks in the y-axis. Any help is appreciated