
I'm trying to understand the results of the AUCell run.
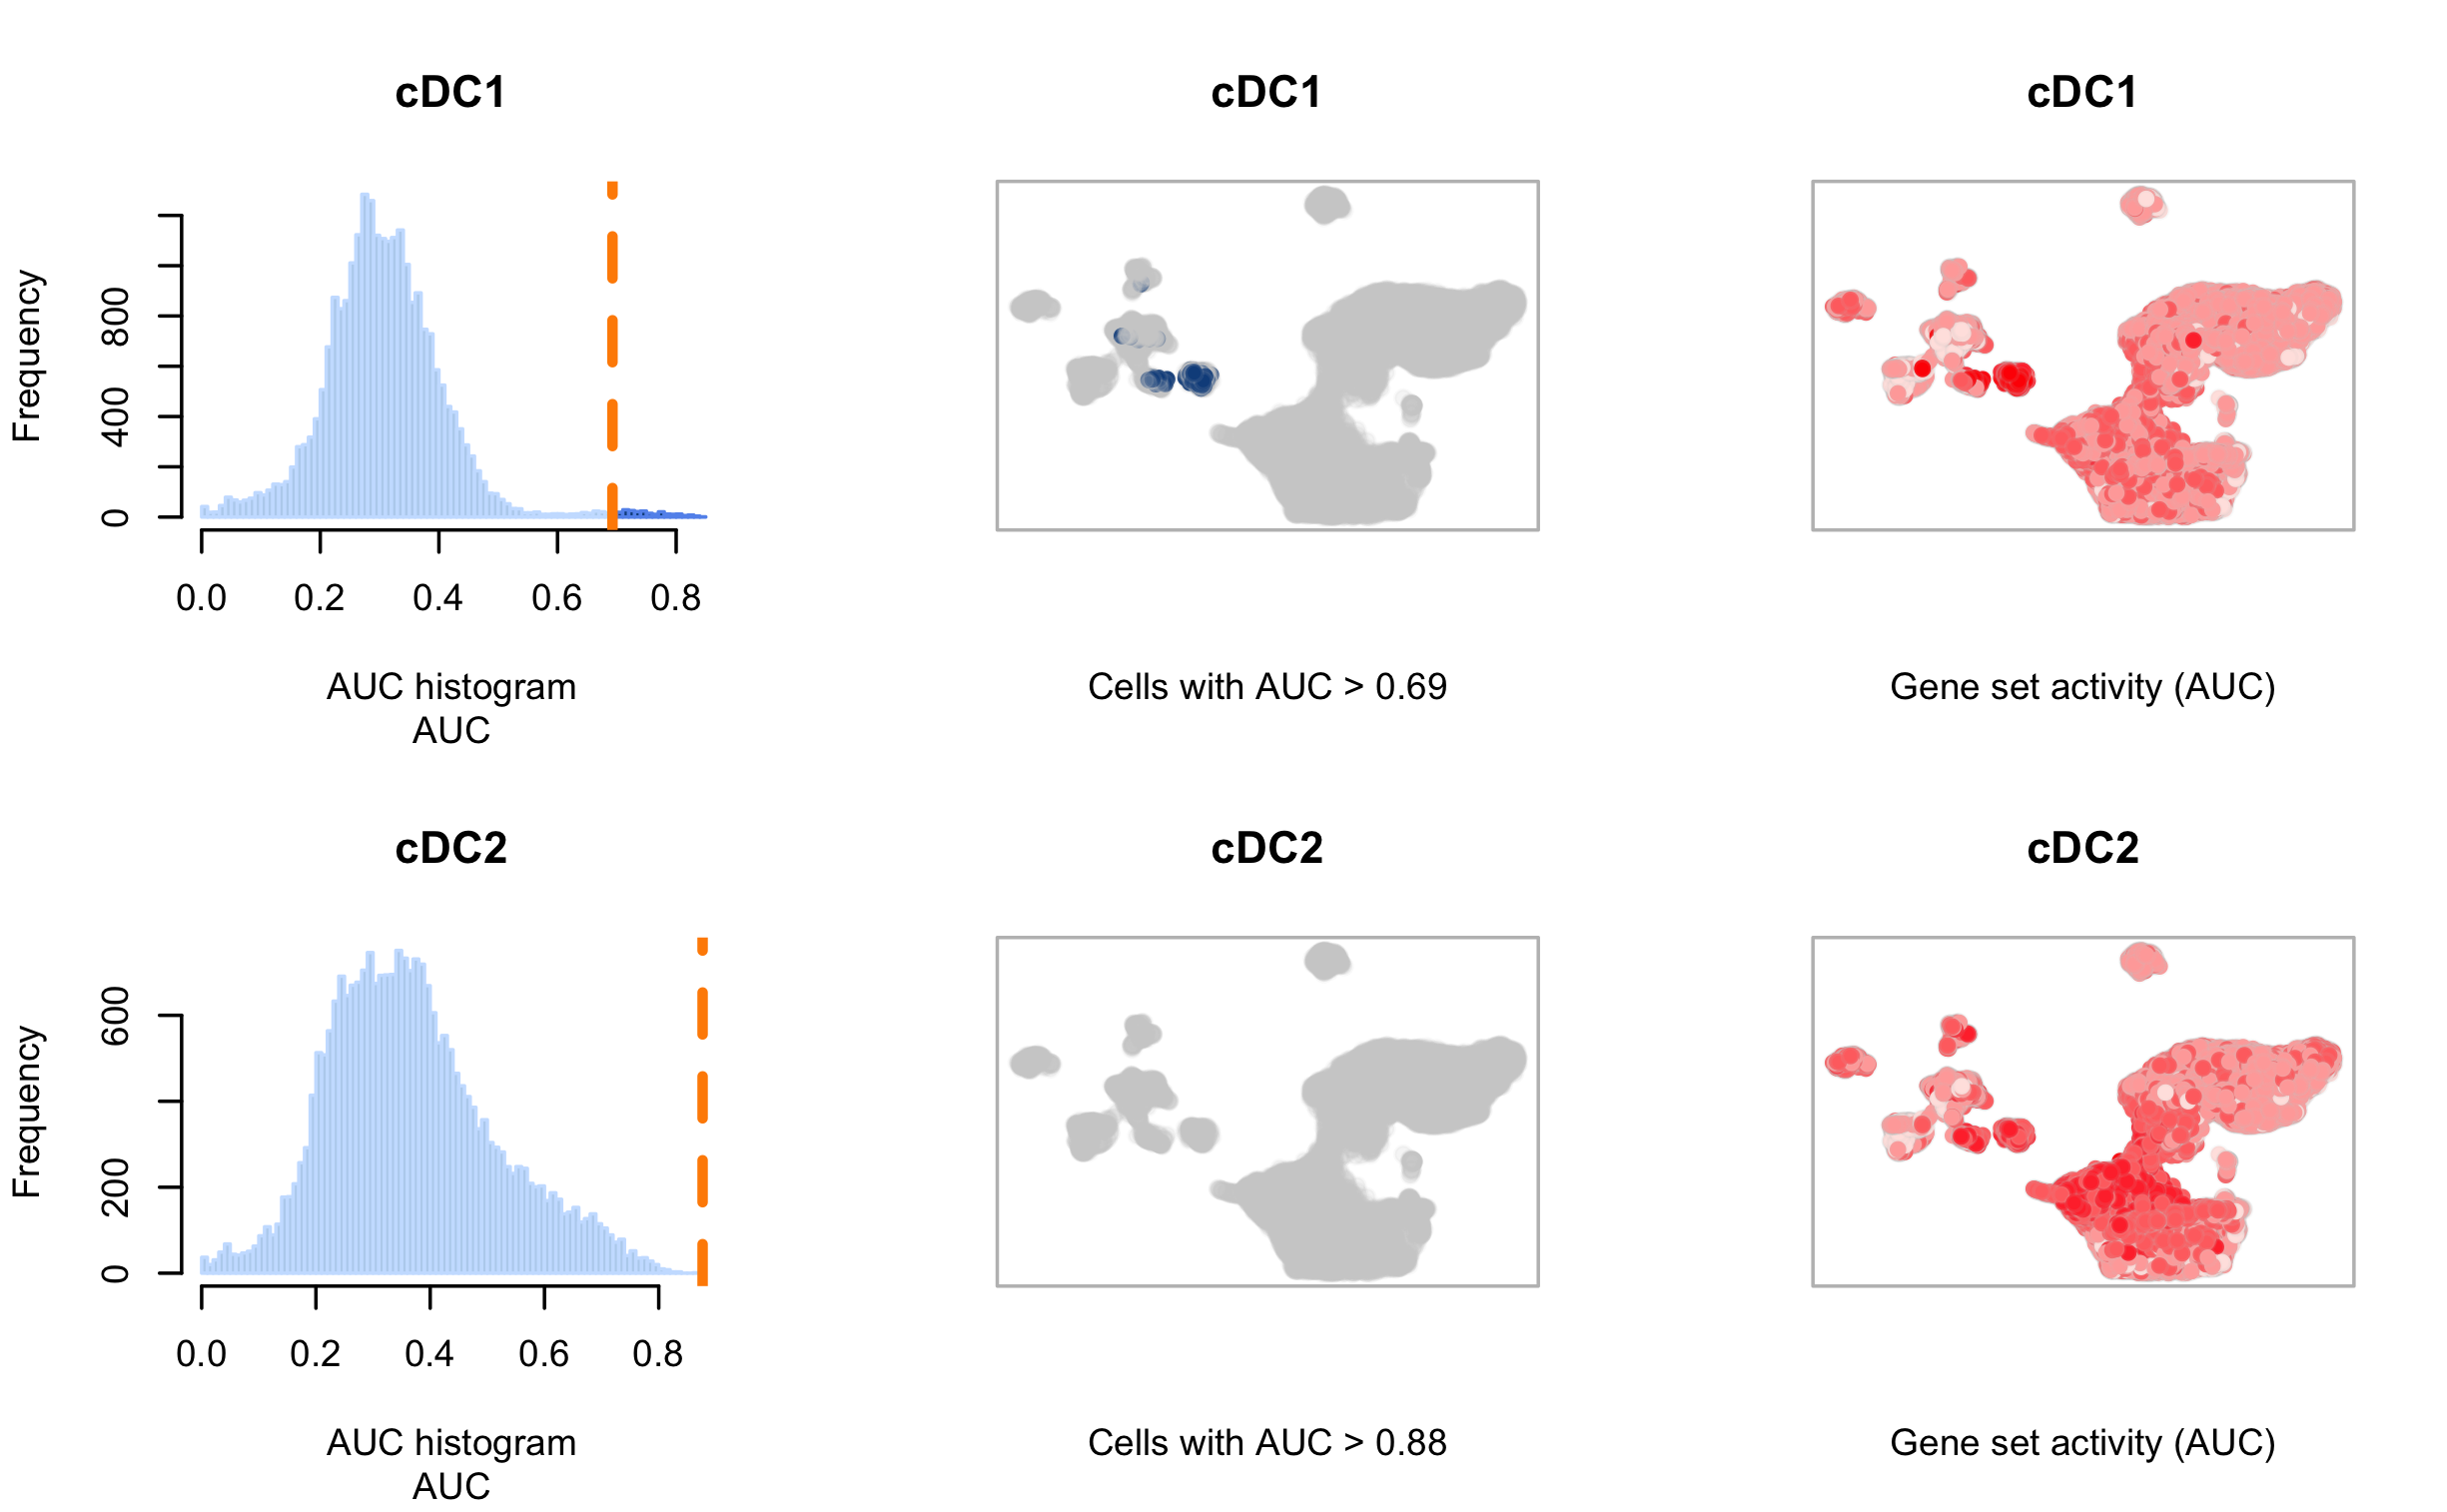
I tested my single-cell data set with specific DC cell-types gene sets. The image below shows two fo the gene sets. for cDC2 i have a very high AUC score, but for some reason no cells are assigned to this category.
If I understand the way the AUC scores are calculated, a high AUC means, many of the genes in the cDC2 gene-set are expressed in the cells, but in the middle plot (created with AUCell_plotTSNE) none of the cells are assigned to this category.
From what I've read, the reason might be connected to the histogram to the left. As I don't have the expected bi-modal behavior, AUCell has difficulties setting a "better" threshold and prefers a somewhat more conservative value. As there are no cells higher of this value, I get an empty UMAP scoring.
On the UMAP to the right though I can see cells with activity in this category. But these cells are not really localized as a cluster, but more spread over multiple regions.
My question is therefore, can I trust AUCell with this value, or do I need to manually assign a lower AUC score to this cell-type. How would I choose a "better" score?
thanks
Understanding complex data results like those from AUCell can be challenging. For easier analysis and better data management on the go you might want to try BBQ999 App for Android. This app helps streamline data visualization and supports better decision-making making it easier to interpret results like AUC scores and gene set assignments.