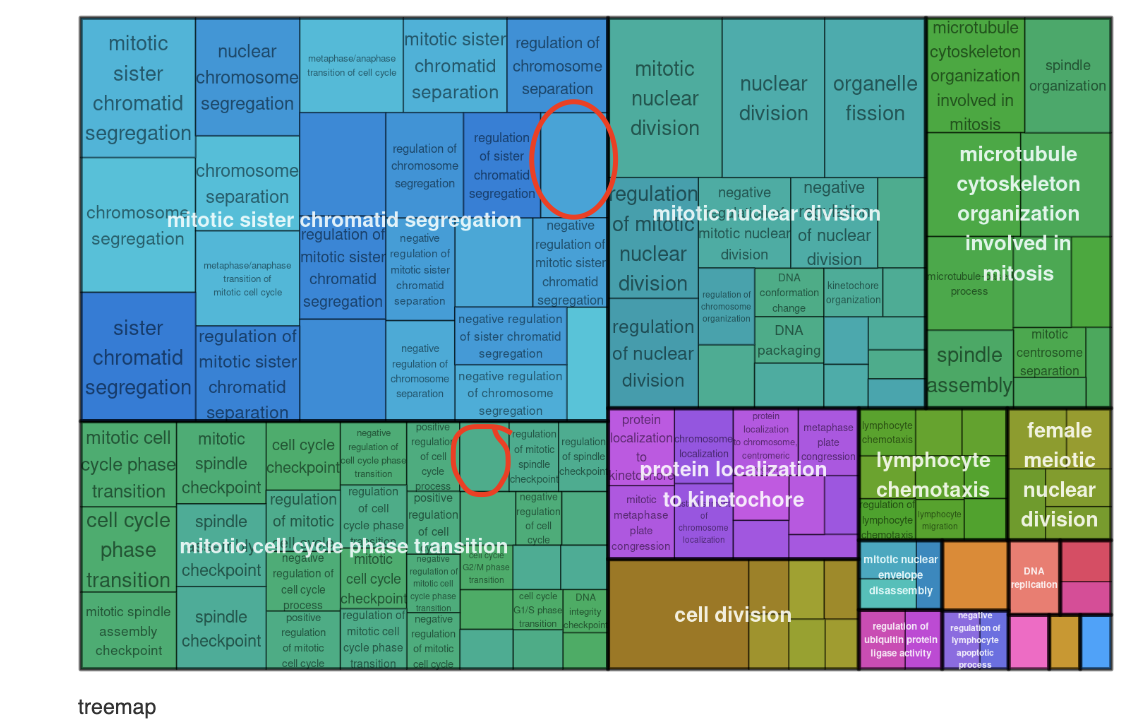
The empty rectangles that you observe in the treemap plot generated by the rrvgo package occur because the underlying treemap package does not display labels for rectangles that are too small to accommodate the text. This behavior is intentional in the treemap package to prevent overlapping or illegible labels. The treemapPlot() function in rrvgo passes its parameters directly to the treemap() function, so it inherits this characteristic.
In the rrvgo vignette, the example treemap visualizes reduced Gene Ontology terms where rectangle sizes are proportional to the score of each term. Small rectangles represent terms with lower scores, and if their area is insufficient, the label is omitted, resulting in what appears as an empty box. The rectangle itself is not empty; it still represents a term and contributes to the overall hierarchy, with color indicating the parent term in the Gene Ontology structure.
To confirm this in your own data, inspect the reducedTerms object passed to treemapPlot(). Terms with small sizes will correspond to these unlabeled rectangles. If you wish to adjust this, you can pass additional arguments to treemapPlot(), such as fontsize.labels or force.print.labels, which are forwarded to treemap(). For example:
treemapPlot(reducedTerms, fontsize.labels = c(0, 2), force.print.labels = TRUE)
This may force labels into small rectangles, though it could lead to overlap. Alternatively, filter your input to exclude low-scoring terms before reduction using reduceSimMatrix() to produce a cleaner plot.
Kevin