
Hi Limpa developers,
Thank you for the great package! I'm so happy to use it.
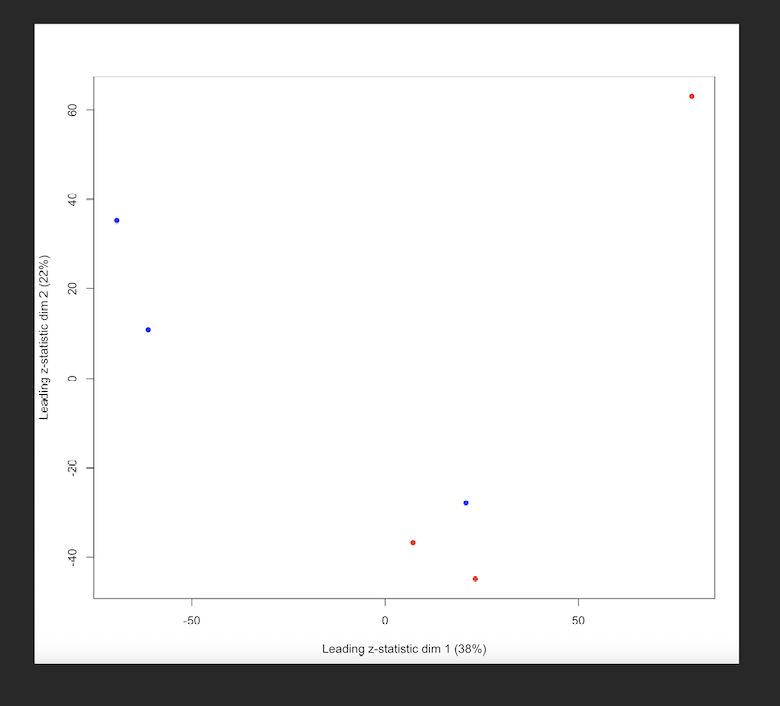
I have a protein level intensity table (around 4600 proteins inferred) from a mouse experiment (3 WT samples and 3 KO samples, WT is the reference level). After running limpa, I noticed that some proteins show large logFC but still have relatively high FDR, which is confusing to me. The MDS plot suggests that there are outlier samples, so my gut feeling is that these samples increased within group variability, leading to high pvalues and FDRs. Having only 3 replicates doesn't much help either.
I followed limpa's vignettes but used fit2 <- eBayes(fit2, robust=T) and limma::normalizeBetweenArrays(method = "cyclicloess").
> topTable(fit2, coef="KO_vs_WT", confint = T) |> head()
                                           PROTEIN GENE_SYMBOL ACCESSION NPeptides   PropObs     logFC       CI.L      CI.R   AveExpr         t
O55226                              Chondroadherin        Chad    O55226         1 1.0000000  2.238540  1.4998398  2.977240  7.056010  6.710509
P15501          Prostatic spermine-binding protein         Sbp    P15501         1 0.8333333 -5.597560 -7.5481291 -3.646991  8.536706 -6.469931
Q9DCM0 Persulfide dioxygenase ETHE1, mitochondrial       Ethe1    Q9DCM0         1 1.0000000  1.608751  0.9927308  2.224770 10.408467  5.782997
Q9EPW4      C-type lectin domain family 3 member A      Clec3a    Q9EPW4         1 0.8333333  2.820516  1.8020354  3.838997  5.828143  6.132459
Q91YN1                             Protein FAM118A     Fam118a    Q91YN1         1 1.0000000  1.680796  1.0213627  2.340229  7.242839  5.644208
P60840                           Alpha-endosulfine        Ensa    P60840         1 1.0000000 -2.040405 -2.8418892 -1.238921  6.902121 -5.637418
             P.Value adj.P.Val         B
O55226 0.00004221111 0.1205903 1.9886820
P15501 0.00010441290 0.1205903 1.2256714
Q9DCM0 0.00014770557 0.1205903 1.1486875
Q9EPW4 0.00009090405 0.1205903 1.1429693
Q91YN1 0.00017995052 0.1205903 0.9074773
P60840 0.00018170999 0.1205903 0.8761251
When I looked at the P15501 and O55226's normalized log2 intensities from y.protein$E, they seem differentially expressed to my eye (sorry about the poor wording), yet somewhat high FDR, which I find it baffling...
| ACCESSION | GENE_SYMBOL | WT1    | WT2   | WT3    | KO1   | KO2   | KO3   |
| --------- | ----------- | ------ | ----- | ------ | ----- | ----- | ----- |
| O55226    | Chad        | 5.917  | 6.013 | 5.879  | 8.666 | 7.773 | 8.087 |
| P15501    | Sbp         | 11.959 | 9.416 | 11.920 | 7.834 | 4.325 | 5.767 |
MDS plot - Red represents WT and blue represents KO.
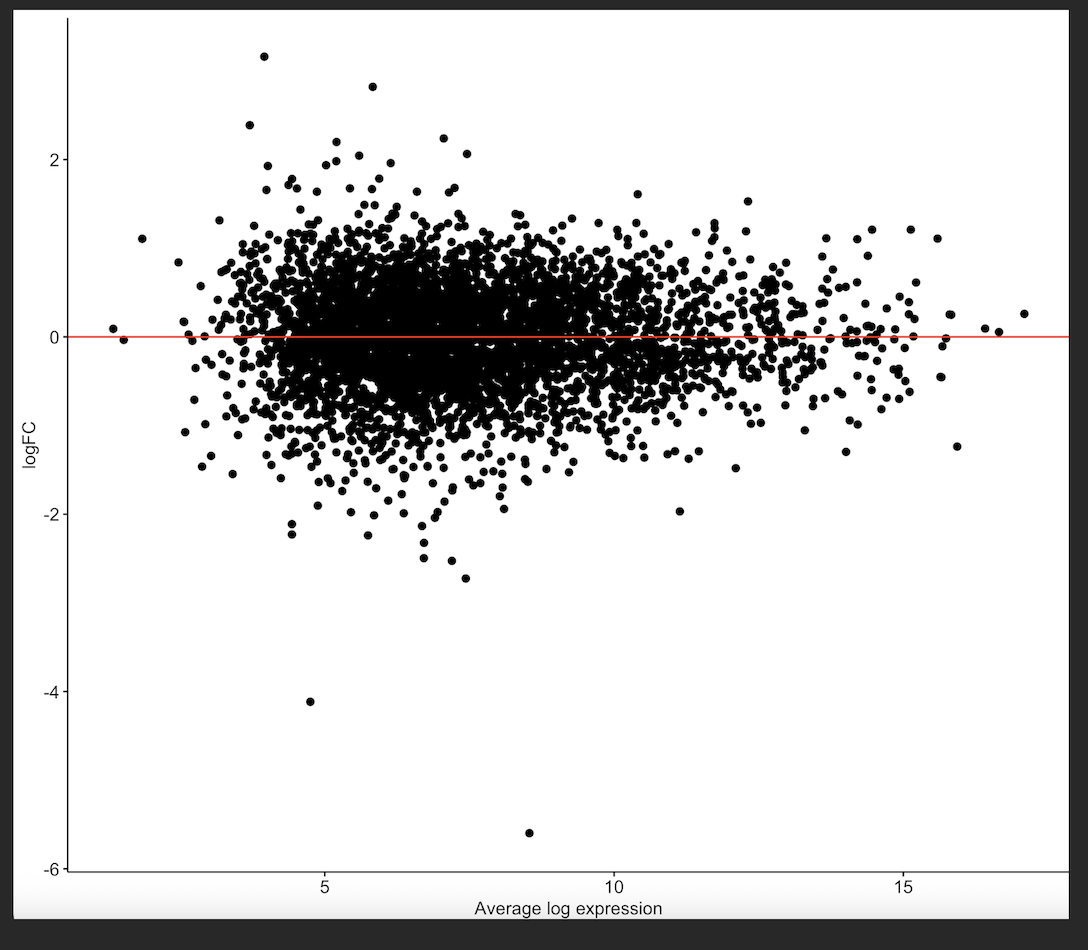
MD plot

forgot to attach some other plots, which may be informative...
RLE plot, after normalization
pvalue distribution
Well, I got duplicate FDRs. For those wondering why there are duplicate adjusted p-values, see p.adjust BH generates duplicate values
I don't know what
tp1is. The relevant histogram would be: