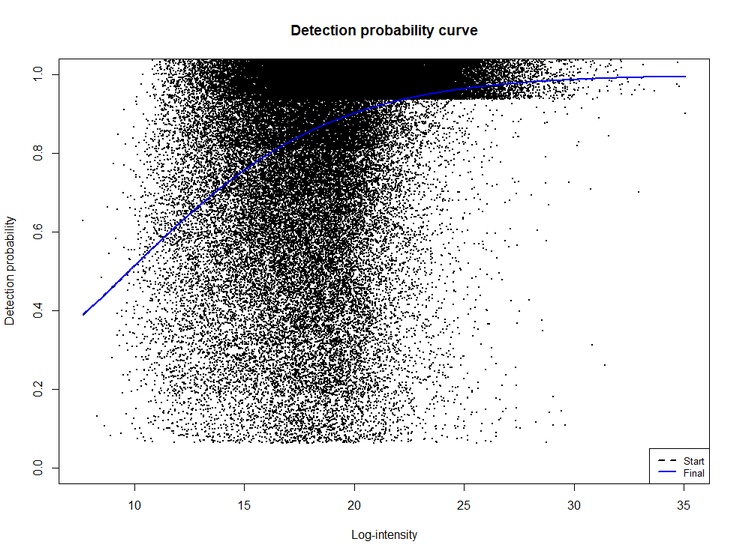
Using limpa with a dataset (not sharable) I got such an estimate from the parquet resulting from DIA-NN. I did not run the DIA-NN processing, so I don't know if some parameters could induce the effect displayed on the plot. As the fit does not adequately match the data, how should I continue the analysis?
It is actually very hard to estimate the DPC from observed data, because the curve is function of unobserved intensities rather than a function of the observed intensities. The visual fit doesn't need to be very good. I am guessing that your data has a lot of DE, or has outlier samples, which makes it especially hard to estimate the curve.
I suggest that you try dpcCN() instead of dpc(), because it is more robust than dpc() to outlier samples. It will give quite a different looking plot because it plots the curve vs estimated intensities instead of observed intensities. Basically, though, I think that the DPC slope should generally be in the range of 0.7-0.8 for DIA-NN data, and I don't think it varies much from dataset to dataset. If dpcCN() isn't giving you a value in that range, I would just run dpcQuant() with a preset value dpc.slope=0.7.
The limpa analysis is not very fragile and will continue to give reasonable results even if the DPC slope is somewhat misspecified. If you run dpcQuant() with a DPC slope that is too low, the analysis will become more conservative but it won't fall over, and it will remain more powerful than simply ignoring the missing values.
Thank you for your comments. Please note that I did not apply any filtering to the peptide intensity. The experimental protocol includes two groups (WT vs. KO), with four replicates per group. All samples were acquired on the same day using an Astral spectrometer. I did not perform the DIA-NN myself and have no experience in adjusting DIA-NN parameters.
As you reported outliers, I performed a limma::plotMDS. The first figure shows the top 5,000 peptides (out of 95,000) and the second shows the 5,000 peptides with the highest mean. Both figures highlight that the KO group is not homogeneous, unlike the WT group. I am currently investigating this point.
I studied the distribution of the mean intensity relative to the number of non-missing values as it was not clear to me on the plotDPC. My code is at the end in order to check I did a msitake. Each distribution was normalized to its highest value (i.e. by line on the heat map). The complete dataset and the dataset divided by group are shown below. There is a slight shift between the KO and WT groups, but I am puzzled by the clear shift of 1 to 2 log2(intensity) between no missing values and one or more missing values. Is this usual? The value missingness seems to be quite independant of the missing value count.
Regarding the slope of the DPC curve, I wonder if it could depend on the characteristics of the spectrometer. Have you worked on an Astral dataset?
# heatmap of mean value distribution as a function of non-missing value count
# ALL samples
res <- list(
  as.data.frame( t( apply( y.peptide, 1, function(x) {
    c( detected = sum(!is.na(x)), mu_obs = mean( x, na.rm = TRUE ) )
  })))
)
names(res) <- "all"
# PER GROUP
res <- lapply( group_levels , function( glv ) {
  as.data.frame( t( apply( y.peptide[ , y.peptide$targets$group == glv ], 1, function(x) {
    c( detected = sum(!is.na(x)), mu_obs = mean( x, na.rm = TRUE ) )
  })))
})
names(res) <- group_levels
# heatmap plot (same for ALL and PER GROUP)
for ( glv in names(res) ) {
  dat <- res[[glv]]
  tbl <- prop.table(table(
    dat$detected, cut( dat$mu_obs, breaks = seq( 8, 38 ) ) ), margin = 1)
  tbl <- tbl[ setdiff(rownames(tbl), "0"),]  # remove 0 count
  tbl <- tbl[ nrow(tbl):1, ]  # reverse order for display
  pheatmap::pheatmap(
    as.matrix( tbl ), cluster_rows = FALSE, cluster_cols = FALSE,
    main = glv)
}
Yes, we use Astral currently. The main dataset in the limpa preprint is Astral.
I don't see any major problems with your data and I think you might be over worrying. Just take my advice to run dpcCN() or use a fixed DPC slope, make an MDS plot of the proteins using plotMDSUsingSEs() instead of the precursors, then run dpcDE() with var.group=group to allow for higher variability in the KO group. It should work fine.
Thanks for your feedback and for reassuring me. :-)
As you suggested, I tried dpcCN() and set the slope to 0.7 in addition to the standard dpc(). I compared all the parameters returned by topTable() using pairwise graphs (applying a logarithmic transformation to the P values). I don't see any noticeable difference, all graphs displaying points perfectly aligned to the diagonal (maybe a tiny dispersion when plotting versus dpcCN fit).
Here are the betas of the dpc fits. What beta value corresponds to a slope of 0.7?
Concerning 2+ and 3+ charged precursors of the same modified sequence, I think each precursor is counted as a peptide. Although each precursor is an evidence, both derived the same sequence. What drives your point of view?
I noticed a few small improvments such as the default ylim for plotDPC( dpcfit, ylim = c( 0, 1+1/dpcfit$nsamples/2 ) ). Should I add them on github?
I prefer for limpa to work on precursor intensities, because my understanding is that precursors are the basic unit of identification and quantification in the DIA pipeline. That has been said by the DIA-NN author here: https://github.com/vdemichev/DiaNN/discussions/951.
limpa can work ok on data at other levels, e.g., peptides or maxLFQ, but we prefer precursors.
There is no need to summarize precursors to peptides before running limpa, in fact that is likely to be slightly harmful.
For DDA data from MaxQuant, the evidence.txt file would be better than the peptide.text file, although limpa will work on either.
limpa doesn't actually care about peptides. All it wants are a set of features that are directly correlated with protein expression, and which are as close as possible to the basic identification and quantification pipeline.
The DPC slope is beta1. The estimated slopes for your data look pretty low, lower than I've ever used for a real dataset. Nevertheless, as you have found, limpa seems pretty robust to a range of slope settings.
I don't understand your question about precursors and peptides and my "point of view". I haven't expressed any opinions about precursors vs peptides as far as I remember.
Happy to get code suggestions. Just describe your suggested code edits, either here or on github, or else email me your edited code file. I prefer to get code suggestions via email or via discussion rather than via git.


Thank you for your comments. Please note that I did not apply any filtering to the peptide intensity. The experimental protocol includes two groups (WT vs. KO), with four replicates per group. All samples were acquired on the same day using an Astral spectrometer. I did not perform the DIA-NN myself and have no experience in adjusting DIA-NN parameters.
As you reported outliers, I performed a limma::plotMDS. The first figure shows the top 5,000 peptides (out of 95,000) and the second shows the 5,000 peptides with the highest mean. Both figures highlight that the KO group is not homogeneous, unlike the WT group. I am currently investigating this point.
I studied the distribution of the mean intensity relative to the number of non-missing values as it was not clear to me on the plotDPC. My code is at the end in order to check I did a msitake. Each distribution was normalized to its highest value (i.e. by line on the heat map). The complete dataset and the dataset divided by group are shown below. There is a slight shift between the KO and WT groups, but I am puzzled by the clear shift of 1 to 2 log2(intensity) between no missing values and one or more missing values. Is this usual? The value missingness seems to be quite independant of the missing value count.
Regarding the slope of the DPC curve, I wonder if it could depend on the characteristics of the spectrometer. Have you worked on an Astral dataset?
Yes, we use Astral currently. The main dataset in the limpa preprint is Astral.
I don't see any major problems with your data and I think you might be over worrying. Just take my advice to run dpcCN() or use a fixed DPC slope, make an MDS plot of the proteins using plotMDSUsingSEs() instead of the precursors, then run dpcDE() with var.group=group to allow for higher variability in the KO group. It should work fine.
Thanks for your feedback and for reassuring me. :-)
As you suggested, I tried dpcCN() and set the slope to 0.7 in addition to the standard dpc(). I compared all the parameters returned by topTable() using pairwise graphs (applying a logarithmic transformation to the P values). I don't see any noticeable difference, all graphs displaying points perfectly aligned to the diagonal (maybe a tiny dispersion when plotting versus dpcCN fit).
Here are the betas of the dpc fits. What beta value corresponds to a slope of 0.7?
Concerning 2+ and 3+ charged precursors of the same modified sequence, I think each precursor is counted as a peptide. Although each precursor is an evidence, both derived the same sequence. What drives your point of view?
I noticed a few small improvments such as the default ylim for plotDPC( dpcfit, ylim = c( 0, 1+1/dpcfit$nsamples/2 ) ). Should I add them on github?
I prefer for limpa to work on precursor intensities, because my understanding is that precursors are the basic unit of identification and quantification in the DIA pipeline. That has been said by the DIA-NN author here: https://github.com/vdemichev/DiaNN/discussions/951.
limpa can work ok on data at other levels, e.g., peptides or maxLFQ, but we prefer precursors. There is no need to summarize precursors to peptides before running limpa, in fact that is likely to be slightly harmful. For DDA data from MaxQuant, the evidence.txt file would be better than the peptide.text file, although limpa will work on either.
limpa doesn't actually care about peptides. All it wants are a set of features that are directly correlated with protein expression, and which are as close as possible to the basic identification and quantification pipeline.
The DPC slope is beta1. The estimated slopes for your data look pretty low, lower than I've ever used for a real dataset. Nevertheless, as you have found, limpa seems pretty robust to a range of slope settings.
I don't understand your question about precursors and peptides and my "point of view". I haven't expressed any opinions about precursors vs peptides as far as I remember.
Happy to get code suggestions. Just describe your suggested code edits, either here or on github, or else email me your edited code file. I prefer to get code suggestions via email or via discussion rather than via git.