
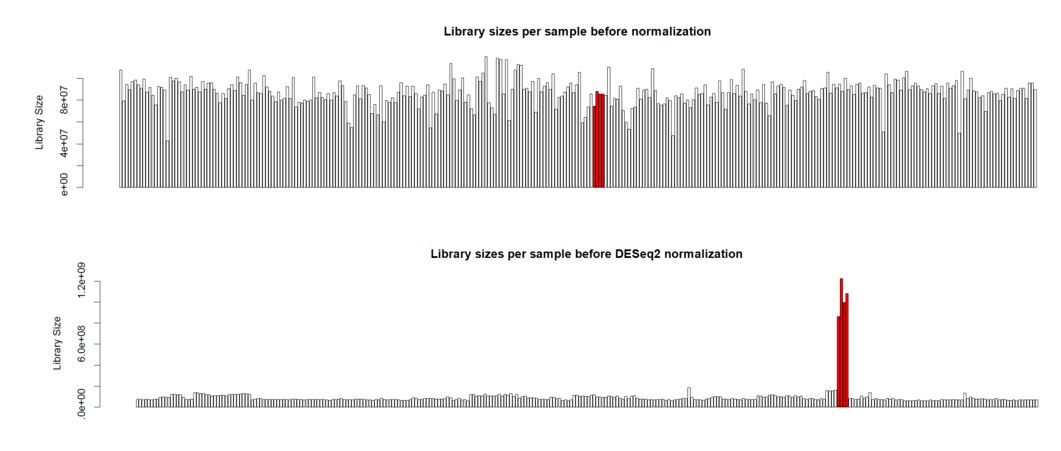
Hello. I'm analyzing a large plant gene atlas study and we're seeing some strange behavior for a set of samples (reps) for a particular tissue. This tissue is known to have a smaller overall number of expressed genes versus other tissues with more highly expressed genes. Plots below are the library sizes before and after normalization (with the 4 unusual samples denoted in red):
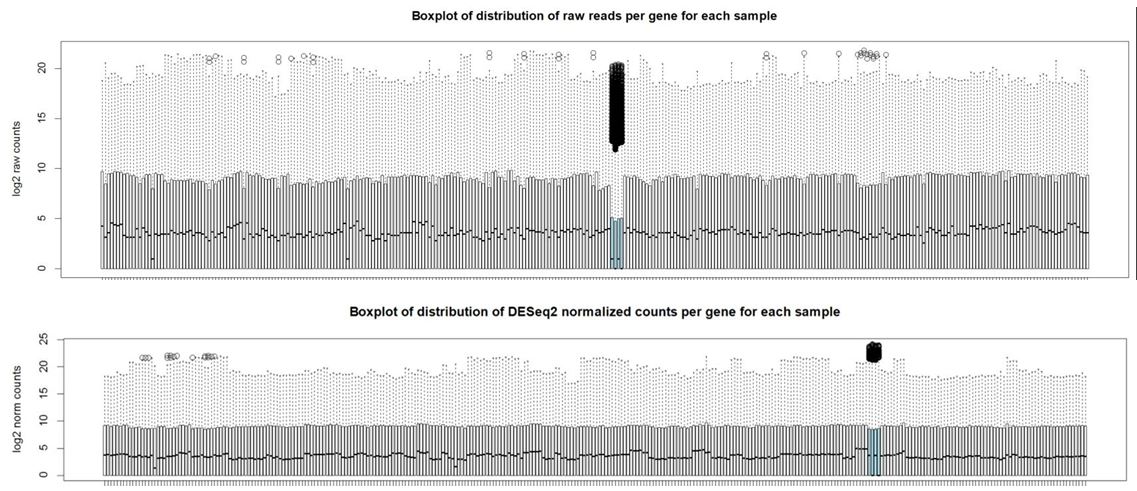
And here are boxplots of the counts per gene per sample before and after normalization (the unusual 4 samples are denoted in blue here)
We do NOT want to do differential expression analysis on these data. We just want to generate plots to visualize the normalized gene atlas data. Typical plant gene atlas studies that I've seen published just use RPKM normalization and plot the RPKM values. I'd prefer to use a more sophisticated form of normalization given all of the problems with RPKM normalization. Any advice on how to handle this data would be appreciated.
Thanks, Julie

Thank you Michael. I also noticed that the overall distribution of read counts per gene after normalization looked reasonable for these 4 samples. It's my naive interpretation that DESeq2 is actually appropriately handling these 4 unusual samples for the majority of the genes. It's just the highly expressed genes that may be over-corrected by DESeq2 which leads to the radical differences in library sizes after normalization. What is your opinion on how to proceed with this data? Should I use the DESeq2 normalized values and just accept that a small handful of genes will be over-corrected? I've also tried analyzing this data using full quantile across lane normalization via EDASeq. This approach brings down the highly expressed genes in these 4 unusual samples to be in line with the other samples/tissues and stabilizes library sizes after normalization. That of course is the purpose of full quantile normalization, but I'm concerned that the distribution disparities in these tissues are violating assumptions of the full quantile normalization method. What is your opinion? Thank you in advance.
"It's just the highly expressed genes that may be over-corrected by DESeq2"
I think you should consider two points:
1) I would recommend examining these 4 samples also via standard QC tools, like FASTQC and MultiQC. Do these pass basic QC? Are these the only 4 samples from that tissue? Was batch and tissue confounded?
2) If for various reasons (1) is not resolving the issue, i.e. QC is fine, and batch is not confounded with tissue here, then you just have a different distribution for those samples, and so you should expect vastly different distribution of scaled and unscaled counts. DESeq2 and other tools scale the counts to be comparable over the median gene according to ratios. So the plot and the normalization is telling you something: relative to the median gene by ratio, this tissue has some genes which are very highly expressed (which accords with what you said in your first post). But if you don't have any kind of spike-in for normalization, or knowledge/presence of genes that are stably expressed across samples, you have to remember that you cannot make any inference about absolute expression levels. I don't think software is going to help you then.