Do I have clustering by library size?
1
0
Entering edit mode
pkachroo ▴ 10
@pkachroo-11576
Last seen 4.2 years ago

Hi,

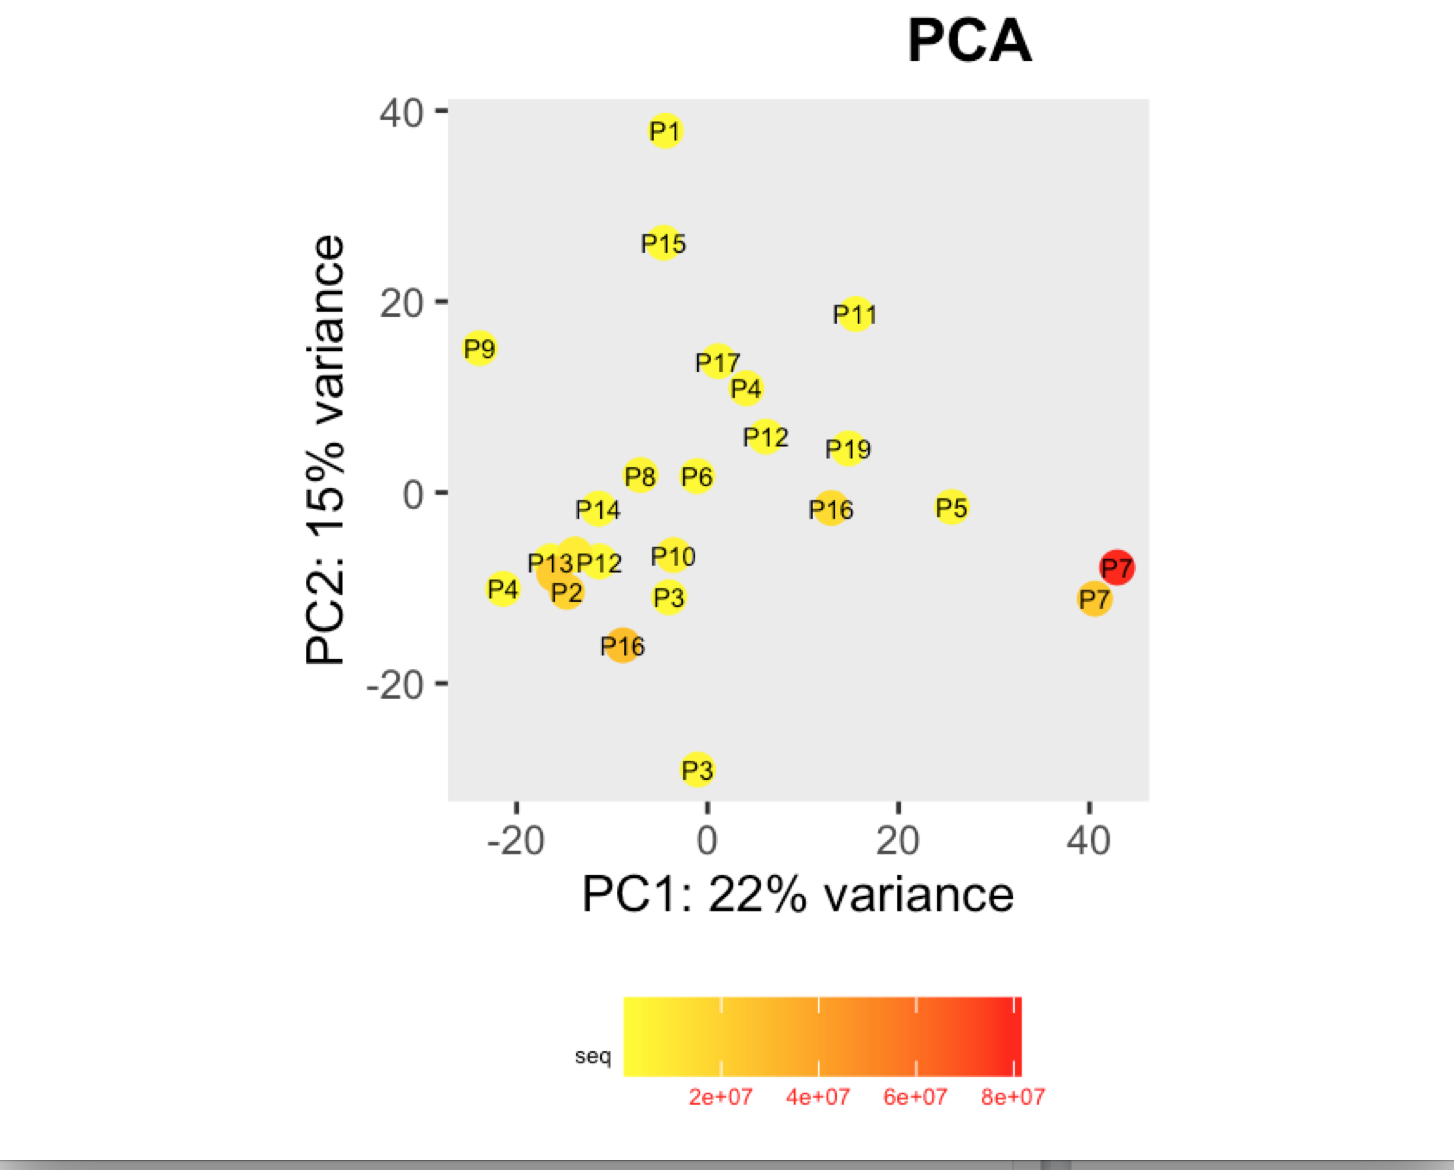
I have a question regarding large differences in library size amongst my samples. These samples are from invivo animal infection experiment and some samples had to be resequenced to get enough reads. I do not have a case/infected and control/uninfected scenario in this experiment, they are just all infected samples. The range of library size in my experiment is 100,000 to 81 million. I generated a PCA plot and colored them by the sequencing depth and wanted to check with the experts if this seems to be a case wherein samples with similar sequencing depth are clustering together? Also, I tried filtering genes that have 0 reads for >50% of the samples and replotted PCA, but it looked exactly the same.

Greatly appreciate help in this regard.
PCA plot

PCA DESeq2 Normalization librarysize • 2.3k views
ADD COMMENT
0
Entering edit mode

To me it doesn't look like it. Couple of notes though: (i) if you end up doing any sort of differential expression analysis, you might want to add the sequencing batch of the libraries as a control (and colour those in a separate PCA) to exclude batch effects, if any exists; (ii) the range of library sizes is quite large. You might need to take special care when analysing.

0
Entering edit mode

Thank you Antonio for your suggestions. Greatly appreciate it.

ADD REPLY
0
Entering edit mode
@mikelove
Last seen 9 hours ago
United States

I don't think there is too much clustering by library size, but the one very highly sequenced sample may continue to drive PC1. You could see what happens if you down-sample that one.

This code will generate a new sample downsampling by p. For example, if you want to bring down the counts by 1/10 for sample j you would set p=.1.

new.cts <- rbinom( nrow(dds), prob=p, size=counts(dds)[ , j] )

Then you can do:

mode(new.cts) <- "integer"
counts(dds)[,j] <- new.cts
ADD COMMENT
0
Entering edit mode

Thanks a lot, Micheal. Downsampling is a great idea. Thank you so much for the code, I will give it a try and report back.

ADD REPLY
0
Entering edit mode

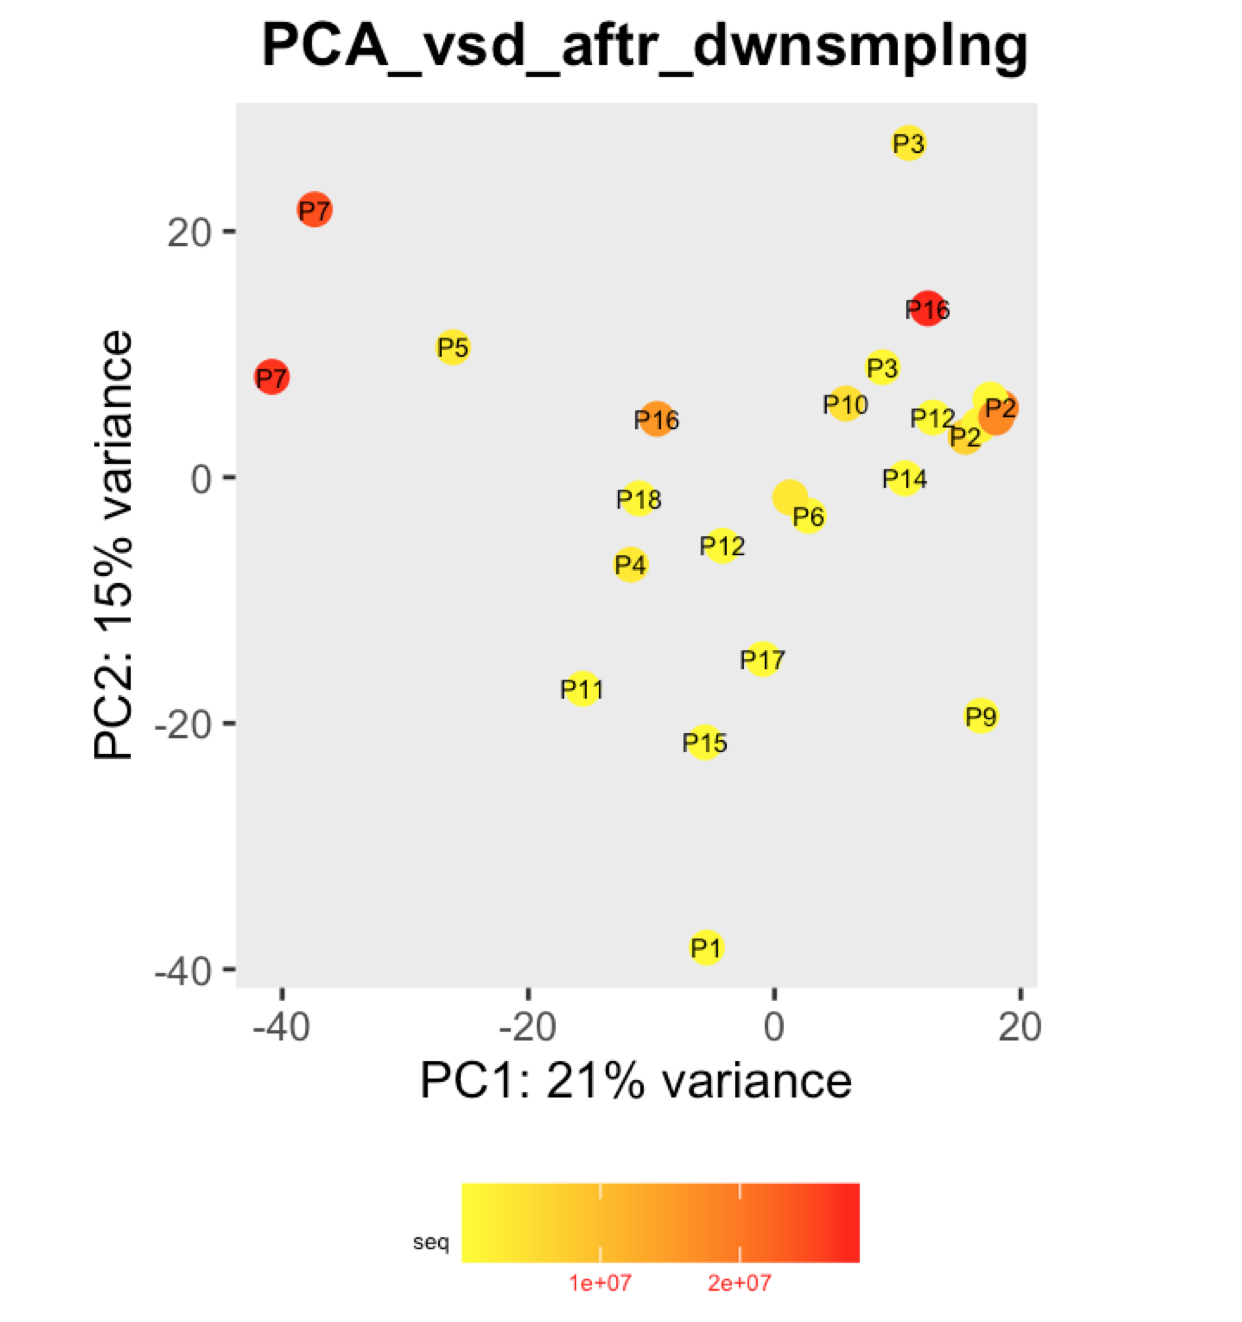
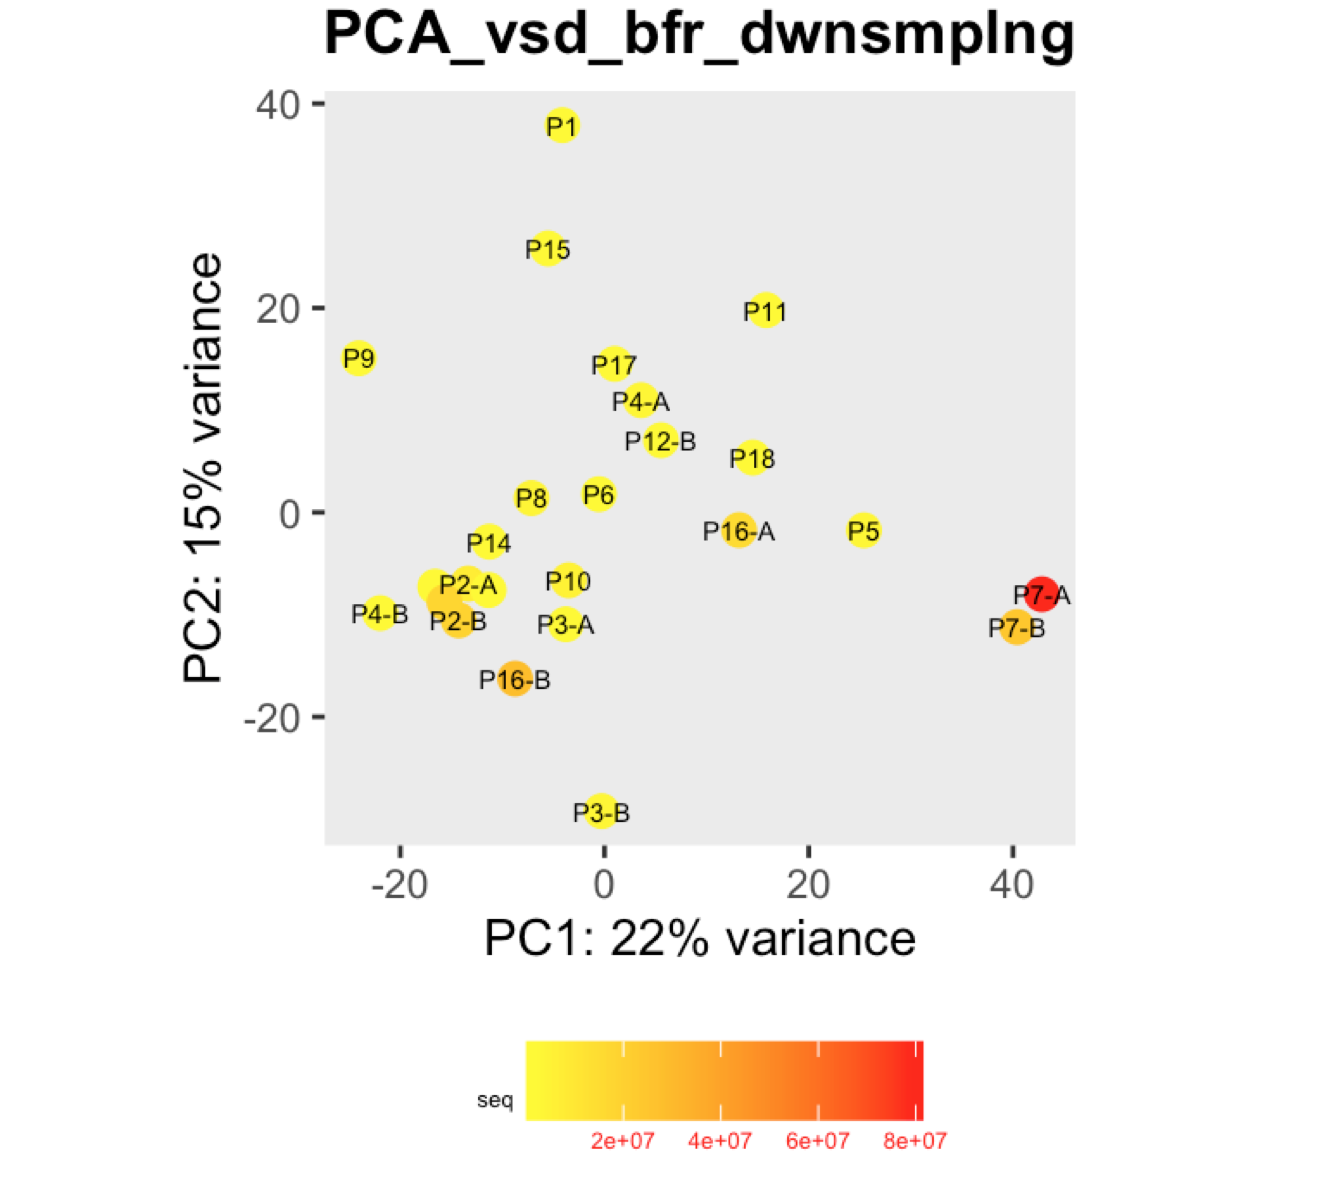
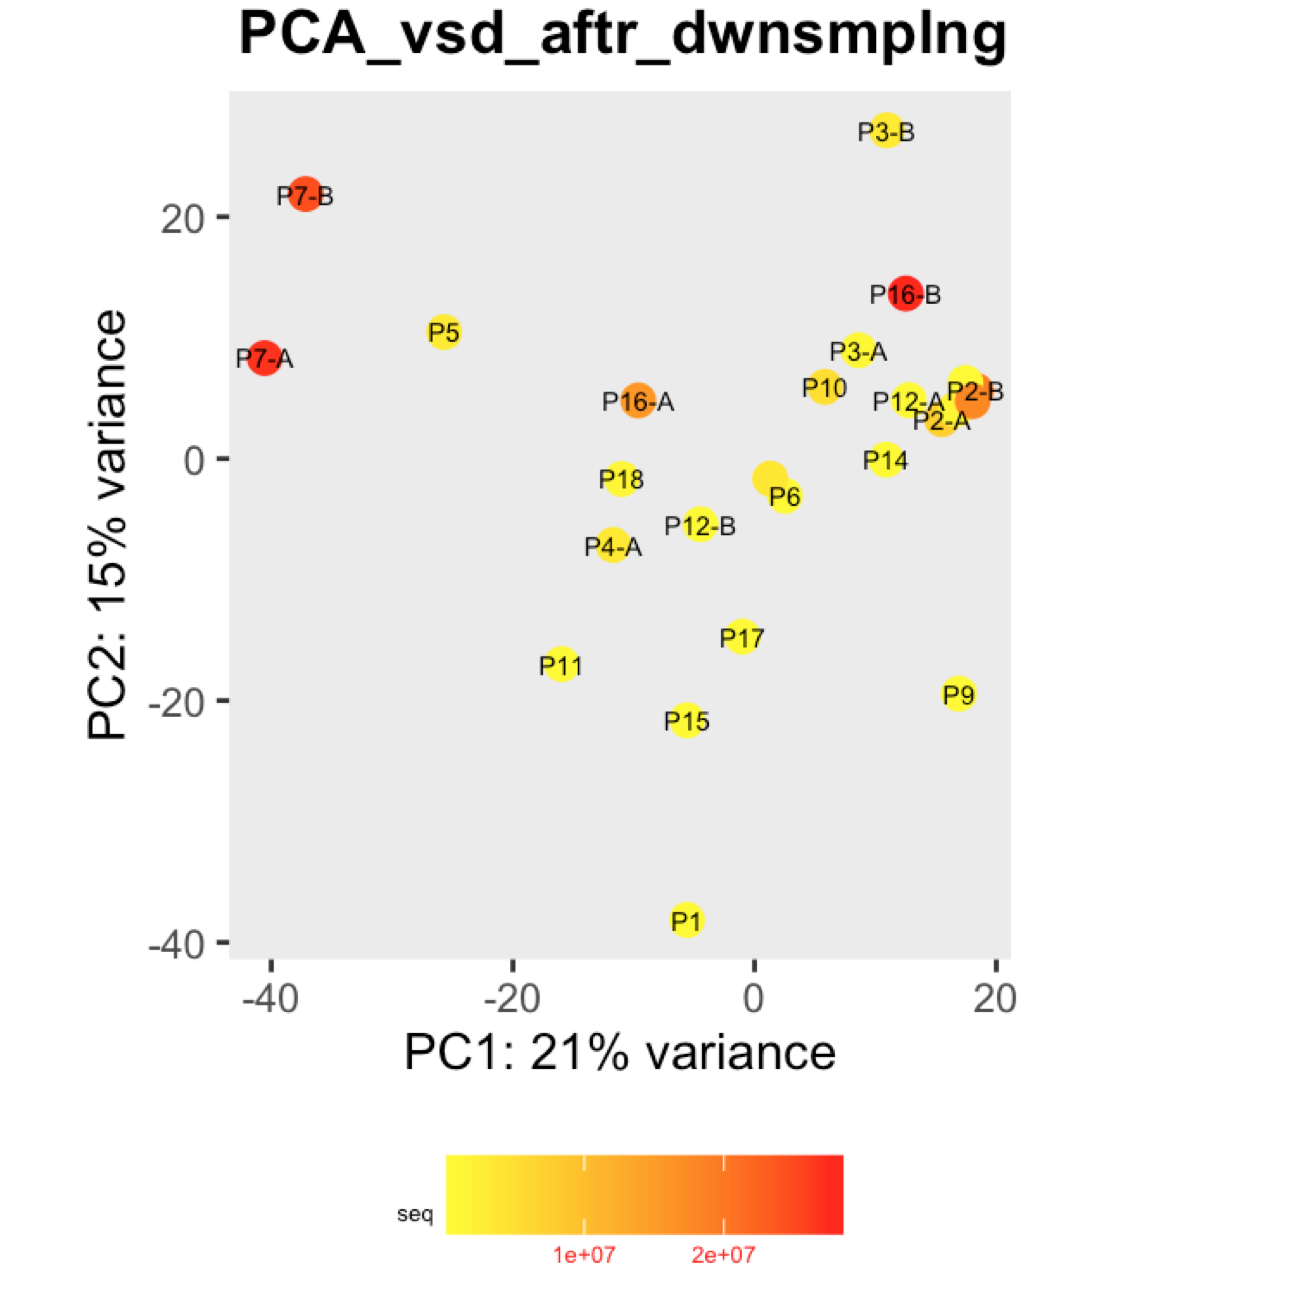
I have regenerated the PCA after downsampling the sample "P7" by 1/3rd (to a similar sequencing depth as its replicate). I do not see any major improvement, what do you think? In our experiment, we had to resequence some samples as they were obtained from total RNA (host+pathogen) and we needed only the pathogen reads. Since pathogen accounted only for a small percentage, we had to resequence multiple samples to bump up the reads. In your opinion, how much variability in sequencing depth across samples is okay to have? enter image description here

ADD REPLY
0
Entering edit mode

Did you put P7 in twice? I would just replace the original P7 with the downsampled one.

ADD REPLY
0
Entering edit mode

Apologize for the confusion. The 2 P7s on the PCA are biological replicates. I have updated the "before" and "after" downsampling PCAs to reflect the same. enter image description here

PCA plots

ADD REPLY
0
Entering edit mode

So then I agree that P7 is still driving PC1 to some extent.

ADD REPLY
0
Entering edit mode

Indeed. Thanks a lot for the code. I have other datasets that may have the same issue with library size variation. Moving forward, in order to maintain consistency across datasets, how do I decide if downsampling is needed?
Look at the PCA's or should I look at the range and downsample all samples that exceed the minimum sequencing depth by a factor of 10? I am hoping to apply the same rule across the datasets as they will be presented in the same manuscript.

ADD REPLY
0
Entering edit mode

Hmm not sure if I have a hard and fast rule. I look at PCA and library size distribution for all datasets.

ADD REPLY

Login before adding your answer.

Traffic: 593 users visited in the last hour
Help About
FAQ
Access RSS
API
Stats

Use of this site constitutes acceptance of our User Agreement and Privacy Policy.

Powered by the version 2.3.6