Entering edit mode

Hello,
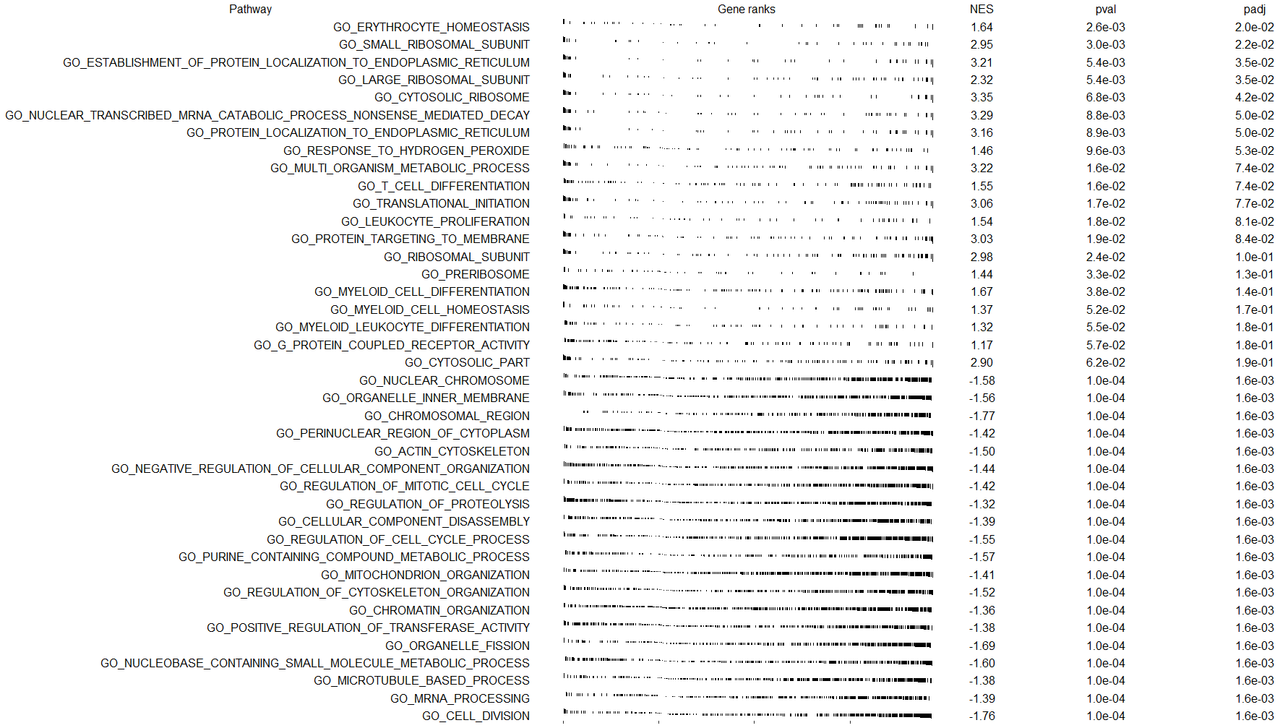
I'm analyzing enrichment scores of MSigDB gene list in the subsets of my single cell rnaseq data. I'm using S2N metric implemented in GSEA (I just wrote a function to perform this for me and feed it into fgsea). I got everything to work but I'm trying to ensure what I see is actually real. Please see the image below as a representative output for top enrichment scores for a subset of my between two conditions. As you can see, most of the significant top hits have the same exact `pval` and `padj` values. Is there a chance this can be just an artifact altogether and p-values may not be trustworthy? Have you experienced something like this before?
I think might have an idea... The sc-rnaseq data type doesn't really feature a high dynamic range of measurements. Unlike counts obtained from a bulk RNAseq, individual cells often register a few copies of a transcript. Therefore, it isn't uncommon to find expression values of 1-3 per gene per cell.
When I was calculating the ranking, this resulted in ties sometimes (around 5-6% of the genes). If the genes in my pathway list happened to be the genes with "low counts" as explained above, this might explain why I don't have a wide range of possible p-values in the enrichment plots. Still, however, considering some pathways have dozens of genes, I don't know how likely this scenario is. I appreciate any insights you might have on this issue.
First, having exactly the same low p-values is normal for fgsea as the algorithm is based on empirical sampling, so there is a minimal possible p-value. I would guess that here you used nperm=10000, hence 1e-4 p-values.
What's strange is high p-values for hign NES values (1.7e-2 and 3.06 for Translation Initiation). Usually low p-values should be tighly coupled with high absolute values of NES (>= 2). Could you put your ranked gene vector here?
Sorry, it took me a while to respond. I'm attaching a csv file with the gene ranking. I don't think it is the same as the initial analysis I posted in this thread, but the same issue persists here as well.
https://nofile.io/f/3Skt1b8xqZ1/neutrophil_ranked_genes.csv