Entering edit mode

karyoploteR::plotKaryotype is great and works fine - thank you, Bernat :-) :
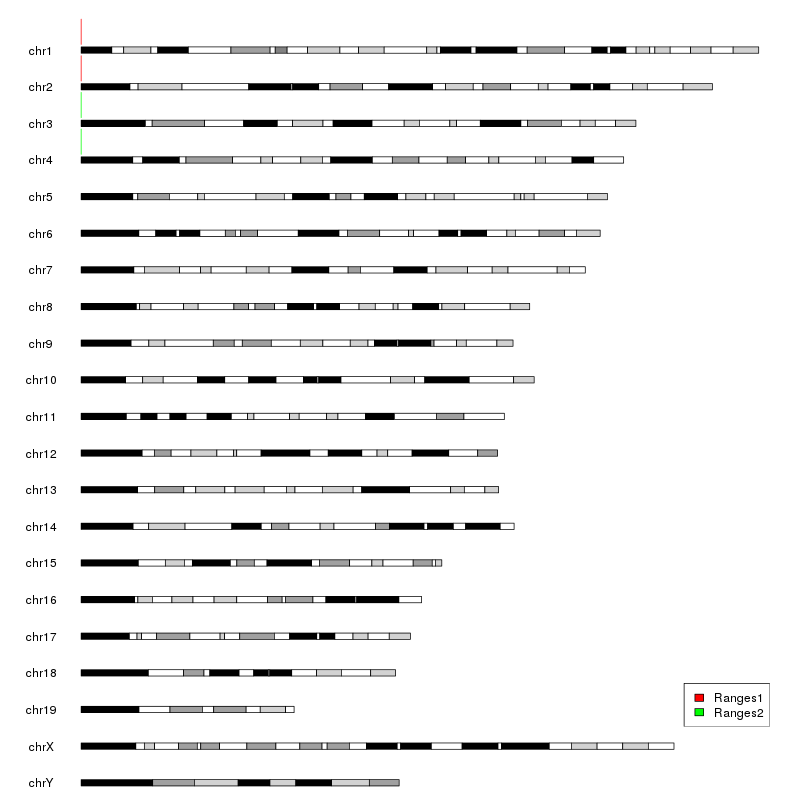
kp <- karyoploteR::plotKaryotype('mm10')
granges1 <- GenomicRanges::GRanges(c('chr1', 'chr2'), c('100-200', '100-200'))
granges2 <- GenomicRanges::GRanges(c('chr3', 'chr4'), c('100-200', '100-200'))
karyoploteR::kpPlotRegions(kp, granges1, col = "red")
karyoploteR::kpPlotRegions(kp, granges2, col = "green")
But how do I add a color legend (explaining what green and red set are)?

Thank you Bernat, for brushing up my rusty base graphics knowledge, and making this great package!
May I ask one more question? Is it possible to store the
Karyoplotobject in a variable and print it to a plot later? This works for ggplot2 and grid. I thought it doesn't for base graphics, but withKaryoplotyou seem to have found a way around.Hehe! glad you find it useful!
karyoploteR is pure base graphics and so it's not possible to store it in a variable to plot later. Actually, karyoploteR plays really bad with graphics composition packages such as grid or the base
par(mfrow=(A,B)). This is something I'd like to improve in the future, but for now the combination of karyoplots with other plots must be done out of R.Hi again,
I just found out you can use
karyoploteRwithgrid,cowplotandpatchworkusing the packageggplotify.You can find the code in this github issue.
Oh, that's pretty cool indeed! Thanks for sharing.