DESeq2 a lot of genes showing up as differentially expressed that only have 1 sample with any expression
2
1
Entering edit mode
hsbio ▴ 10
@hsbio-14446
Last seen 4.6 years ago

Hello,

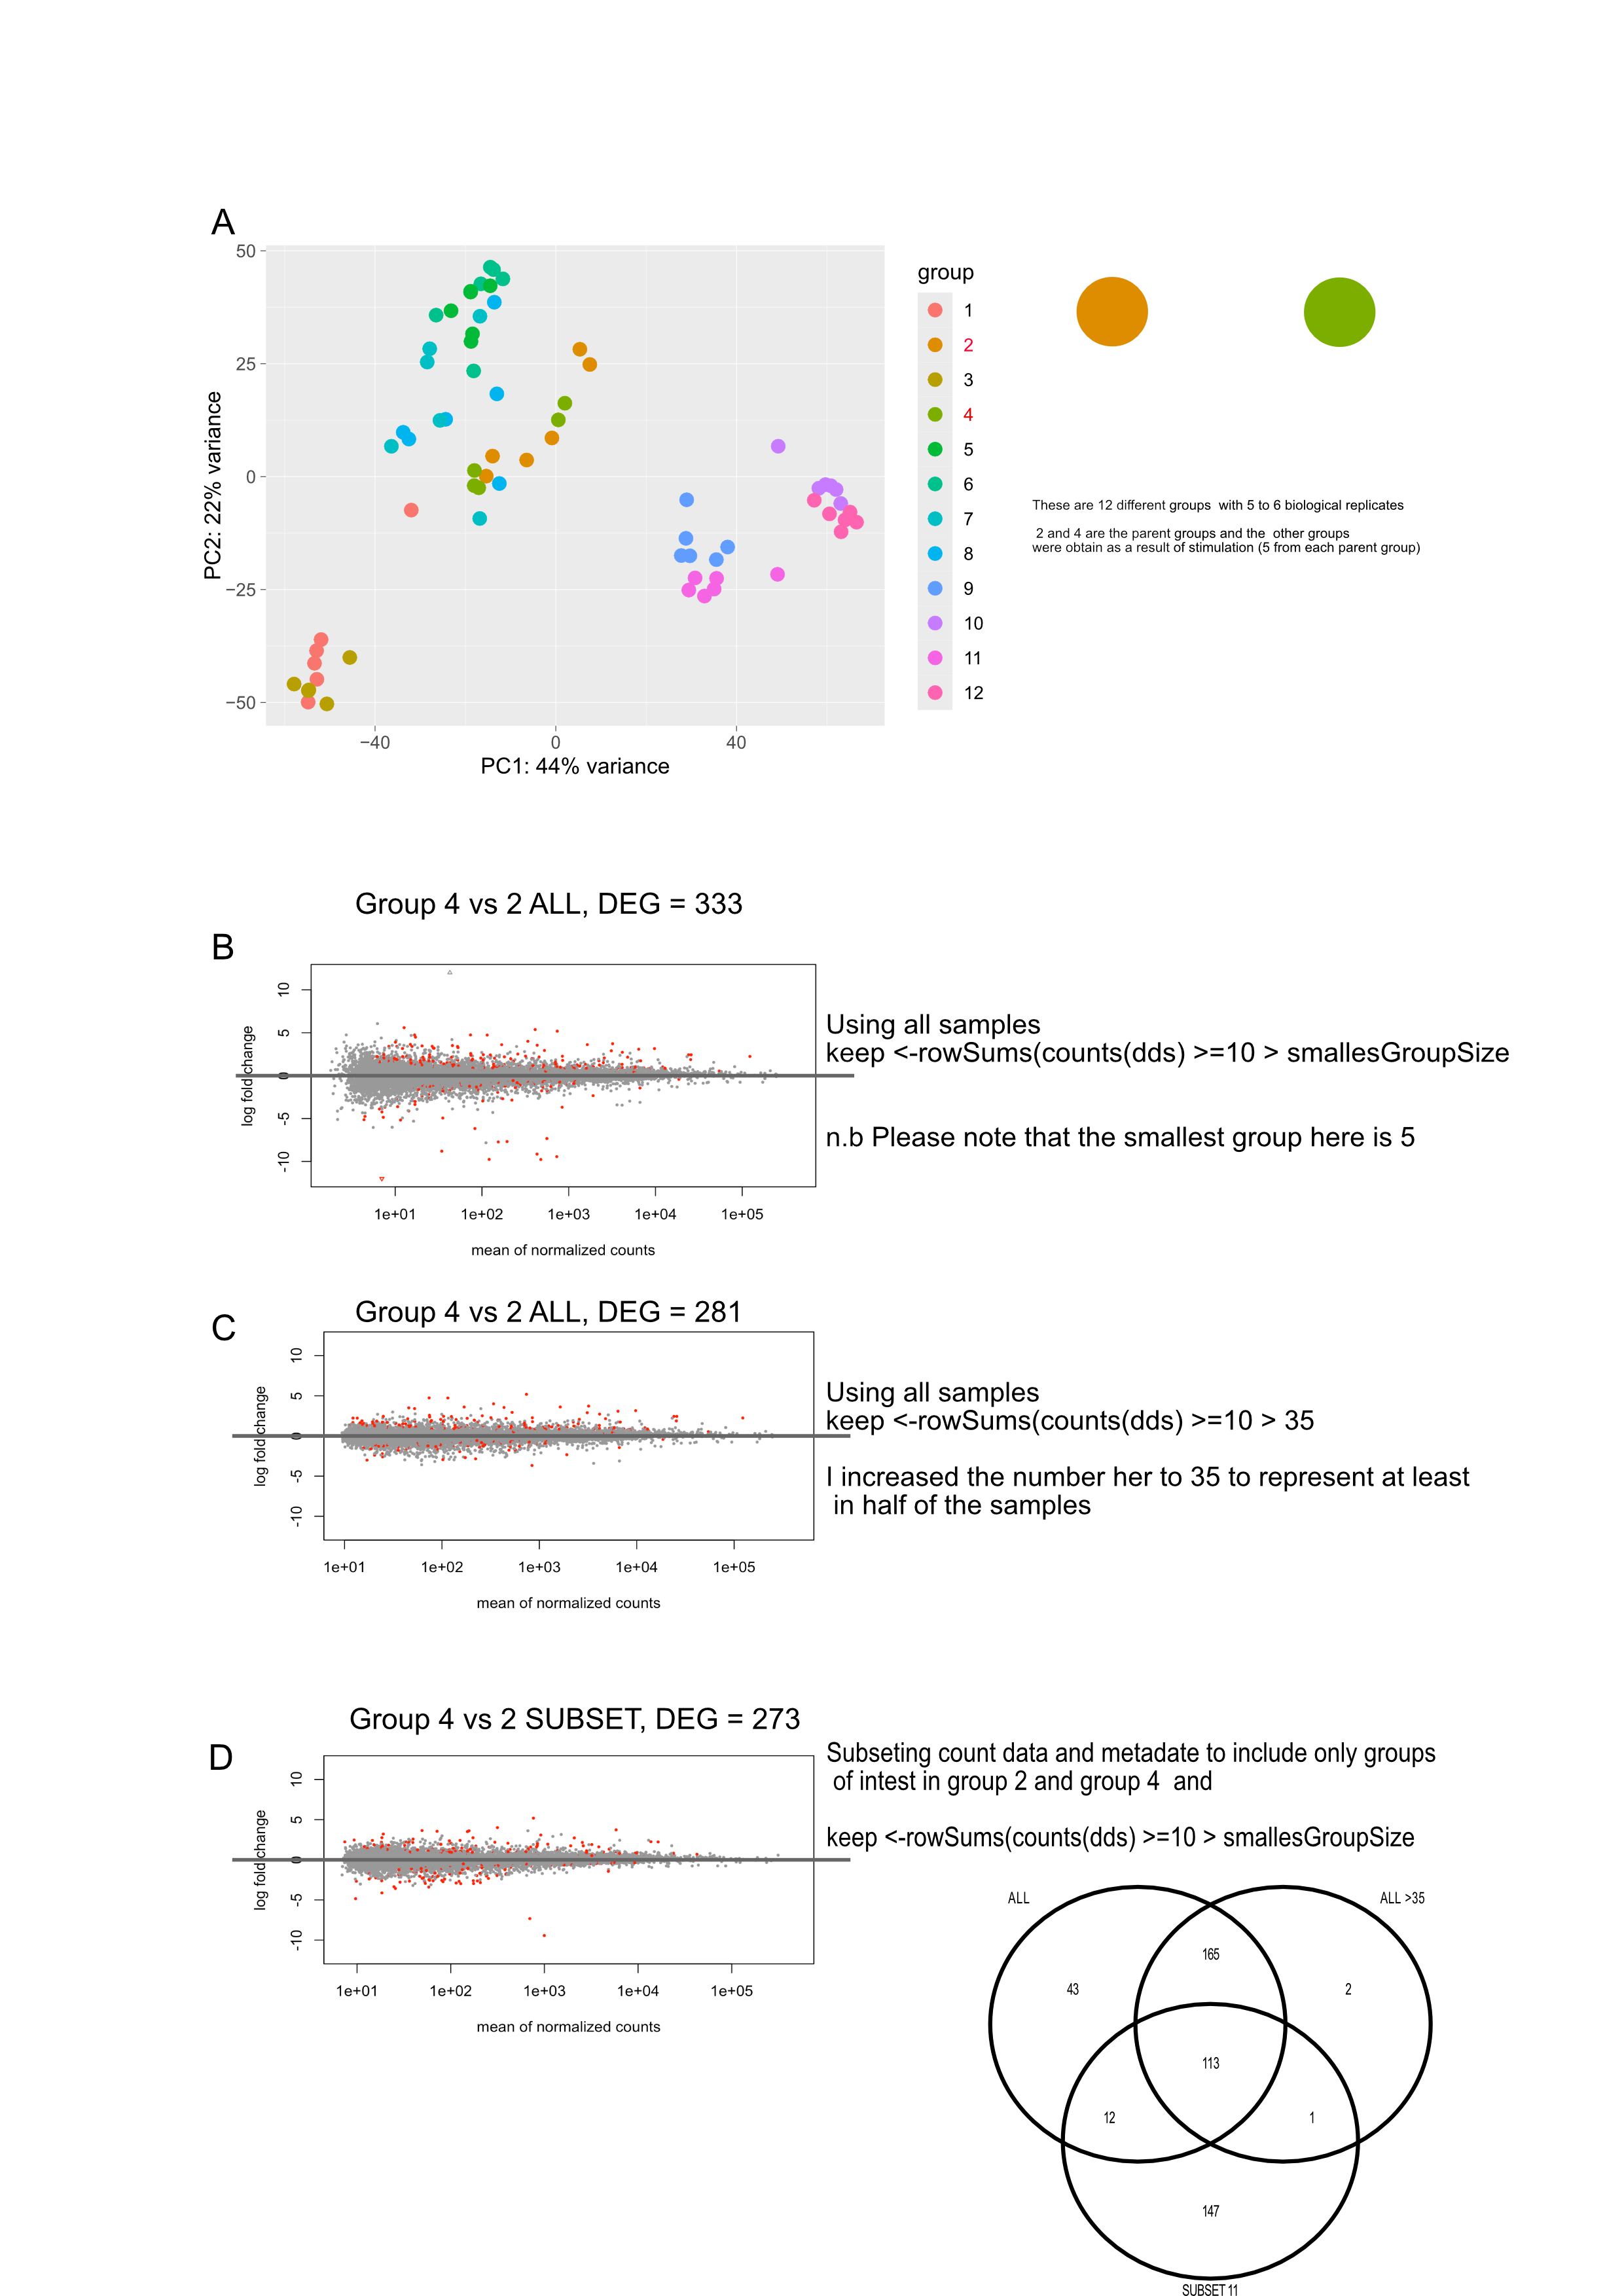
I've done some differential expression analysis with 3 main groups (3 or 4 biological replicates for each group, 11 total samples). When comparing any two of the groups, there are a number of genes that are statistically significant (in some cases, quite a lot) that have very high log2FoldChanges (~15-35) with high standard errors (~4). Upon further inspection, it seems what is happening with at least some of these genes is that only 1 or 2 replicates (out of 3 or 4) are expressing a gene with the other samples showing 0 expression/counts. Now these samples are from primary tissue, so I'm not surprised that there is quite a bit of variability. However, I'm not sure how to best deal with these genes, I understand that they might still be statistically significant but I'm not sure how to best deal with it.

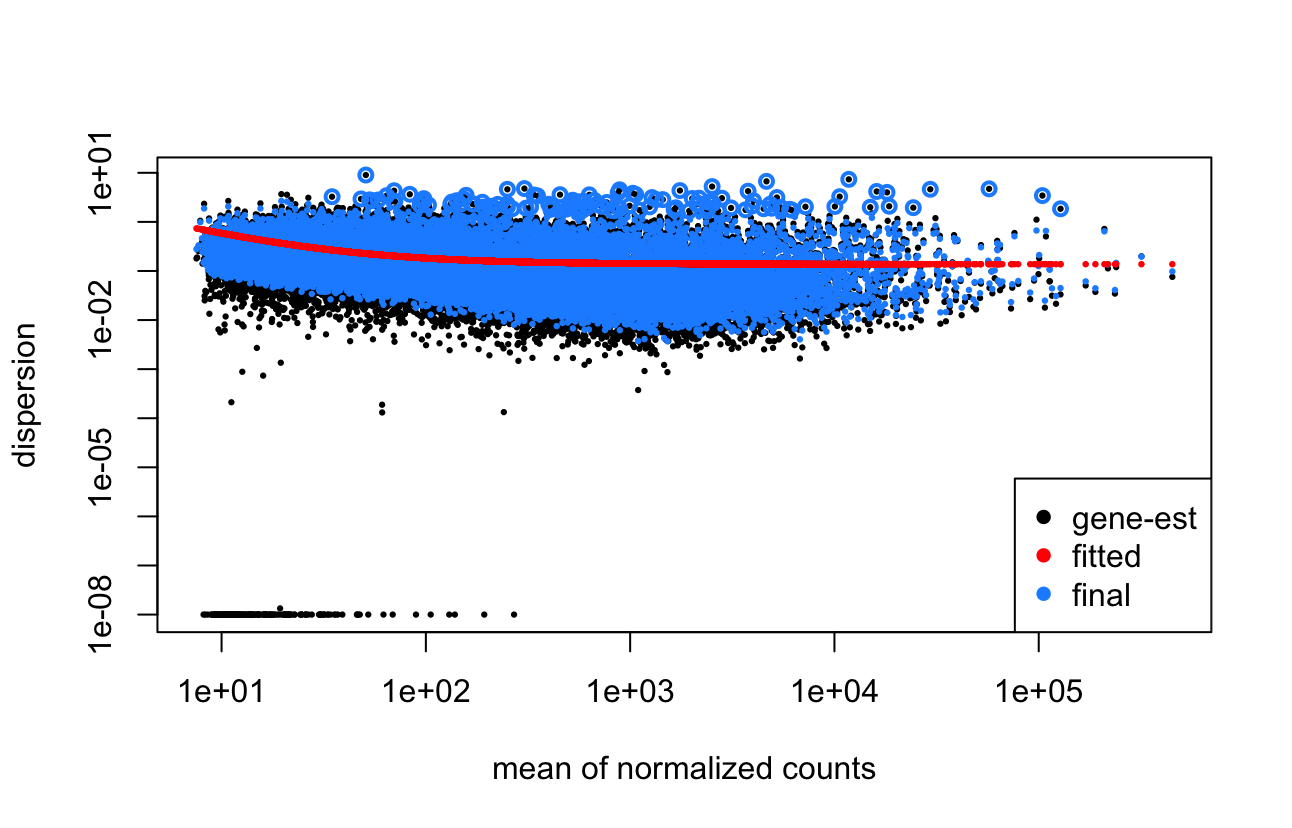
MA-plot example here: https://imgur.com/a/bNOvVWY

So, I was wondering what the best way the handle this would be. The ways I have thought to do it are:

  1. Just leave it as is.
  2. Pre-filter the data to only include genes that have non-zero counts in at least 2 of the 11 total samples (or perhaps in at least 1 sample of each group)? - This should get rid of some of these cases?
  3. Set some sort of standard error filter (lfcSE), but I have no idea what exact value would be reasonable here or if this is reasonable at all.
  4. Should I use lfcShrink using apeglm? Currently these results are just using results(dds) with a lfcthreshold set. If I use lfcShrink, can I then use the shrunken log2 fold changes while still using the adjusted p values from results(dds)?

Any thoughts on these or any other suggestions would be greatly appreciated.

Thanks.

EDIT: It seems DESeq2 might not be removing any outliers based on the cookscutoff due to how my design and samples are set up (see comment below), however I am still not sure how to best deal with this. Apologies for not mentioning this.

Updated Sample Info:

Samples are from 3 different tissues (3 or 4 replicates per tissue) which are sometimes from the same mice (my design is ~mouse + tissue), however mostly there is only 1 or 2 samples from a mice.

deseq2 • 2.2k views
ADD COMMENT
1
Entering edit mode
Dario Strbenac ★ 1.5k
@dario-strbenac-5916
Last seen 4 hours ago
Australia

It seems that the genes which you mention are not being detected as outliers, otherwise they would have p-values of NA. You can set the value of cooksCutoff to a number smaller than 0.99, which will cause more genes to be eliminated from statistical testing. edgeR has a similar approach which uses observation weights to reduce the influence of outliers by giving them less weight, rather than eliminating the gene from the analysis.

ADD COMMENT
0
Entering edit mode

Thanks for your response

Looking into this more, I noticed that actually no genes are being filtered as outliers (i.e. based on cooksCutoff) and then I realised that this is due to my design (or at least I think it is). So essentially, my samples are from 3 different tissues which are sometimes from the same mice (my design is ~mouse + tissue), however mostly there is only 1 or 2 samples from a mice. And looking at the cookCutoff, it only works on samples that have at least 3 replicates and because of the mouse sample group, this isn't true for most of them. It seems like this might be the main issue as to why these genes are still being included. Sorry for not mentioning this.

However, I'm not sure what to do here. I could just remove mouse from the design (I can't really see any clear influence of it on a PCA plot) but I'm not sure this is ideal?

Thanks

ADD REPLY
1
Entering edit mode
@mikelove
Last seen 5 hours ago
United States

You can remove these genes at the start with

keep <- rowSums(counts(dds) >= 10) >= 3
dds <- dds[keep,]
ADD COMMENT
1
Entering edit mode

Dear Michael, may I please also ask a question regarding this. I have 12 different groups with 6 biological replicate each.

Using: keep <- rowSums(counts(dds) >= 10) >= 6 dds <- dds[keep,]

Only about a hundred genes is filtered off.

And comparing 2 groups (eg. for one gene, only one sample had an expression of 456.1942353 and the rest (all 11 was 0). and this gave a fold change of 21.10, fdr of 2,43993E-11 and p value of 1,02332E-14 and lfcSE 2,727406085.

Could you kindly direct me on how to solve this problem please? Thank you and I look forward to you reply,

ADD REPLY
0
Entering edit mode

You should filter this gene, it must not have been filtered if it passed through ("all 11 was 0").

Did you filter before you ran DESeq()?

ADD REPLY
0
Entering edit mode

Thank you Michael for your reply.

Yes I ran DESeq() after filtering using the command

keep <- rowSums(counts(dds) >= 10) >= 6 dds <- dds[keep,]

Is it wise and acceptable to change this filtering to

keep <- rowSums(counts(dds) >= 10) >= 72 (all samples in the 12 different groups having 6 replicates each) dds <- dds[keep,]

as high expression in the other groups seems to be retaining the genes in my present contrast.

Thank you.

ADD REPLY
0
Entering edit mode

Well you could filter for the comparison (subsetting) or raise the required number of samples. Either works

ADD REPLY
1
Entering edit mode

Dear Michael, I tried all three ways (the orIginal, increasing the number of required samples,and subsetting (the countdata and metadata before running the analysis). All gave differing number of DEG with an overlap of deg. (the orginal(333 DEG), increasing the number of required samples(281 DEG),and subsetting(273 DEG)

Does a PCA maybe inform whether subsetting the groups is a better option ?

Please find attached a summary of the , thePCA,ma plot and a venn diagram of deg. summary

Thank you very much. Kind regards, Seyram

ADD REPLY
0
Entering edit mode

I don't really have any additional suggestion here.

ADD REPLY
0
Entering edit mode

Thank you very much!. I will give raising the required number of samples a try. I will also like to try filtering for only the comparison, so as not to lose some important genes for specific comparison. Is there a way (line of code) to do this please or do I manually subset the gene matrix and the metadata also? Thank you.

ADD REPLY
0
Entering edit mode

Yeah the latter (manual subset and filter). I guess it is two lines of code.

ADD REPLY
0
Entering edit mode

Thank you Michael for your attention to my question. I am truly grateful.

I subsetted the data using lines of codes to include only the groups of interest and the filtering is much better now.

Regarding my dispersion estimate plot I have notice a group of genes clustering in the bottom left of the plot. Should these also be taken out or are they genes of interest with very low variance and does this occur usually?

Thank you. Kind regards, Dispersion estimate Seyram.

ADD REPLY
0
Entering edit mode

These genes are fine. They are just the ones where, by chance, the sample variance is below the sample mean. It happens. DESeq2 brings these estimates in line with the others, there is nothing extra to do.

ADD REPLY
0
Entering edit mode

Thank you very much for your reply! I will do so. Kind regards, Seyram

ADD REPLY
0
Entering edit mode

Thanks.

This seems to get rid of the majority of those cases.

Just to confirm, if I then still apply lfcShrink with apeglm, using those shrunken log fold changes with the adjusted p values (from results(dds), rather than the calculated s values) is still reasonable for things like visualization/ranking?

ADD REPLY
1
Entering edit mode

Yes, this is fine to use shrunken LFC for visualization and ranking, and adj p for FDR sets.

ADD REPLY

Login before adding your answer.

Traffic: 750 users visited in the last hour
Help About
FAQ
Access RSS
API
Stats

Use of this site constitutes acceptance of our User Agreement and Privacy Policy.

Powered by the version 2.3.6