Entering edit mode

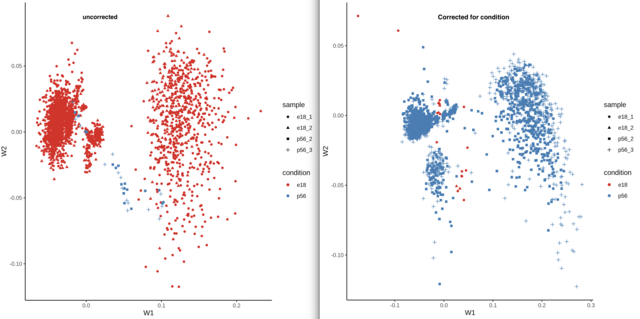
my data contains two developmental stages (early and post) with two samples each, I have tried to plot the low-dimensionality representation using the K parameter in the zinbwave function.
The same sample was plotted, once corrected for possible bias within the condition column ( the separation between early and late) and one without it.
Can you explain, why there is an opposite representation of the same data, when the correction was used compared to the standard expression behavior?
To get the Matrix I have used the follwoing commands
IntegratedData.rowVars_zinb <- zinbwave(IntegratedData.rowVars, K = 0, epsilon=1e12, observationalWeights=TRUE, normalizedValues=TRUE, residuals = TRUE, BPPARAM=MulticoreParam(12))

IntegratedData.rowVars_zinb_condition_K2 <- zinbwave(IntegratedData.rowVars, X="~condition", K = 2, observationalWeights=TRUE, epsilon=1e12, normalizedValues=TRUE, residuals = TRUE, BPPARAM=MulticoreParam(12))
thanks