
Hi there,
I do apologise if this question has been posted already: I am plotting some gene tracks with ggbio/autoplot and would like to plot genes (not transcripts, or collapsing the transcripts into genes), but I'd like to have close/overlapping genes not plotted on top of each other.
the code is not different from the vignette
genePlot <- ggbio::autoplot(Homo.sapiens, which = zoomchr, gap.geom = "chevron", stat = "identity")
if I use stat="identity" I get a quite messy plot, understandably

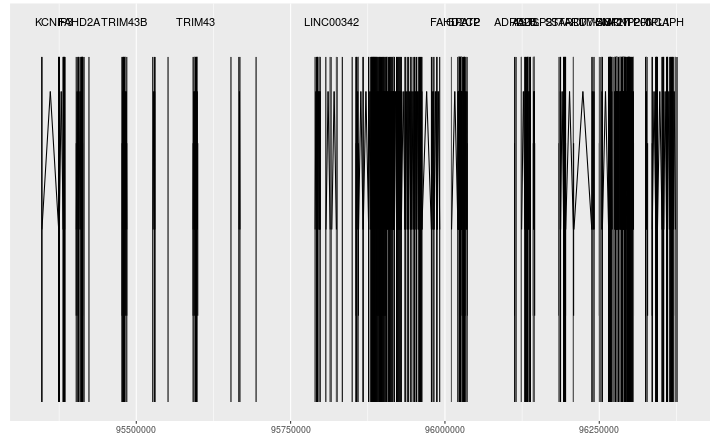
In these plots for example I would like to reduce into a single gene GPAT2, but keep the gene on a separate level compared to FAHD2CP which partially overlaps.
Is there any elegant way to solve this, i.e. collapsing transcripts into gene models but plotting the genes not on top of each other when they overlap? :)
thanks,
Francesco
> sessionInfo()
R version 3.2.2 (2015-08-14)
Platform: x86_64-pc-linux-gnu (64-bit)
Running under: Ubuntu 14.04.3 LTS

locale:
 [1] LC_CTYPE=en_US.UTF-8       LC_NUMERIC=C               LC_TIME=en_US.UTF-8        LC_COLLATE=en_US.UTF-8
 [5] LC_MONETARY=en_US.UTF-8    LC_MESSAGES=en_US.UTF-8    LC_PAPER=en_US.UTF-8       LC_NAME=C
 [9] LC_ADDRESS=C               LC_TELEPHONE=C             LC_MEASUREMENT=en_US.UTF-8 LC_IDENTIFICATION=C

attached base packages:
[1] stats4    parallel  stats     graphics  grDevices utils     datasets  methods   base

other attached packages:
 [1] Homo.sapiens_1.3.1                      TxDb.Hsapiens.UCSC.hg19.knownGene_3.2.2 GO.db_3.2.2
 [4] OrganismDbi_1.12.1                      org.Hs.eg.db_3.2.3                      RSQLite_1.0.0
 [7] DBI_0.3.1                               TxDb.Hsapiens.UCSC.hg38.knownGene_3.1.3 GenomicFeatures_1.22.13
[10] AnnotationDbi_1.32.3                    Biobase_2.30.0                          GenomicRanges_1.22.4
[13] GenomeInfoDb_1.6.3                      IRanges_2.4.8                           S4Vectors_0.8.11
[16] SNPRelate_1.4.2                         gdsfmt_1.6.2                            ggbio_1.18.5
[19] ggplot2_2.1.0                           BiocGenerics_0.16.1                     BiocInstaller_1.20.3

loaded via a namespace (and not attached):
 [1] Rcpp_0.12.4                biovizBase_1.18.0          lattice_0.20-33            Rsamtools_1.22.0
 [5] Biostrings_2.38.4          plyr_1.8.3                 futile.options_1.0.0       acepack_1.3-3.3
 [9] zlibbioc_1.16.0            rpart_4.1-10               Matrix_1.2-5               labeling_0.3
[13] splines_3.2.2              BiocParallel_1.4.3         stringr_1.0.0              foreign_0.8-66
[17] RCurl_1.95-4.8             biomaRt_2.26.1             munsell_0.4.3              rtracklayer_1.30.4
[21] nnet_7.3-12                SummarizedExperiment_1.0.2 gridExtra_2.2.1            Hmisc_3.17-3
[25] XML_3.98-1.4               reshape_0.8.5              GenomicAlignments_1.6.3    bitops_1.0-6
[29] grid_3.2.2                 RBGL_1.46.0                GGally_1.0.1               gtable_0.2.0
[33] magrittr_1.5               scales_0.4.0               graph_1.48.0               stringi_1.0-1
[37] XVector_0.10.0             reshape2_1.4.1             latticeExtra_0.6-28        futile.logger_1.4.1
[41] Formula_1.2-1              lambda.r_1.1.7             RColorBrewer_1.1-2         tools_3.2.2
[45] dichromat_2.0-0            BSgenome_1.38.0            survival_2.39-2            colorspace_1.2-6
[49] cluster_2.0.4              VariantAnnotation_1.16.4
