
Hello,
I have a question regarding the shape of my MA plot using deseq2. Basically I have two conditions that I am comparing (two types of blood cells within the mouse embryo), and three samples for each condition. I have noticed that in my dispersion, MA, and volcano plots there are a set of genes which are expressed in one condition but close to 0 in the other. I've included an MA plot after apeglm shrinkage, depicting that particular behavior. My suspicion is that it might be a closely related, contaminating/differentiating sub-population within the overall population that might be explaining these trends. I'm wondering whether any pre-filtering could be applied, or other techniques, that might be able to distentangle these genes from the overall analysis. I hope the explanation was ok, and thanks for any insight!
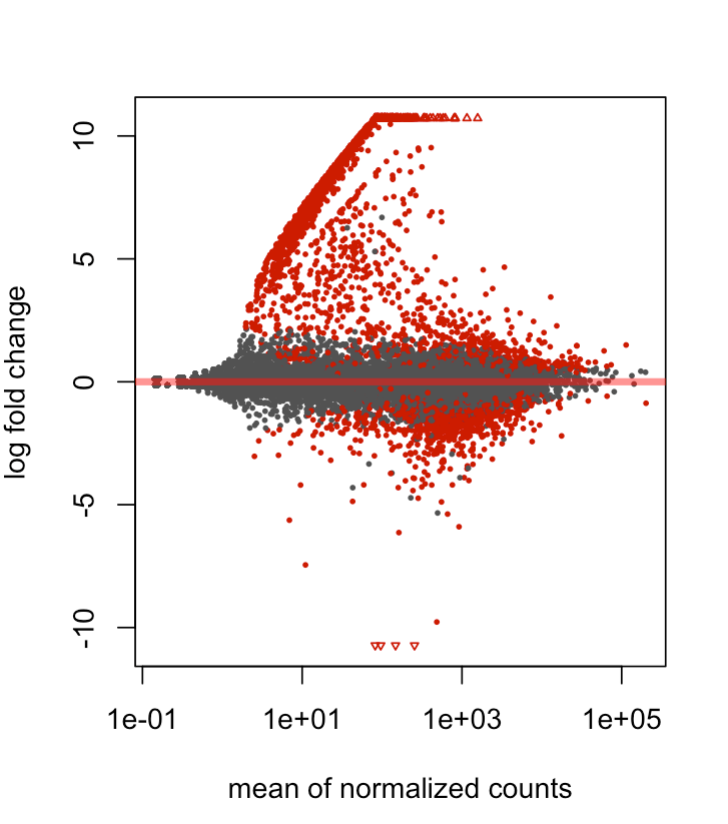

Great, thanks! I used an X val of >5 and Y val of <5 normed counts, and it seems like there's a strong differentiated lymphoid cell profile. A follow up question I have is: Is it justifiable to show these genes, and then somehow adjust for them/filter them out in downstream analyses? I Imagine single-cell analysis would've been preferable here but wondering if this can be salvaged. Thanks again!
I'm not sure best practice to filter them out, and don't have recommendations for adjusting -- these are just DE genes according to your sample groups. You can't really adjust if the composition is highly confounded with your groups.
You could just label the genes as those in functional categories (or using purified cell populations) related to lymphoid cells.