I've wrapped my head around PCA of RNA-seq data a couple times in the past, but seem to always forget what exactly is being done. Most resources do not use gene expression in their example, and so concepts are lost when trying to extrapolate.
Anyone know of a good walkthrough (beginner level!) for PCA analysis of RNA-seq data sets?
Thanks!


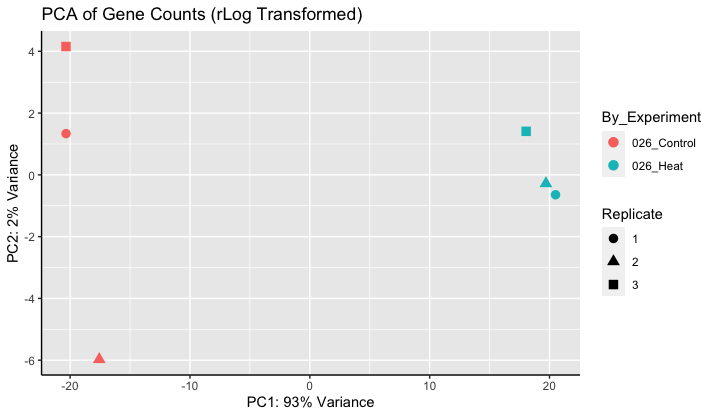
Thanks for the resources. The video was helpful. Once the PCA plot is made, what are the units of the axes? Plots like the one below are slightly confusing, because PC2 explains only a small amount of the variation, yet samples are highly separated. Setting equal axes limits would decrease the this some (is this valid?), but I don't think it fully explains the separation on the y-axis?
If you use plotPCA we do fix the coordinates (and we provide code for how to fix coordinates if you are customizing the plot, see the link to the workflow I posted above).
The axes are linear combinations of the original dimensions, which are VST (log2 scale). I would say they are not easily interpretable.
The visual separation is not the only aspect that drives variance. Just a toy example:
A = [1,2,3,4,5,6] (no separation) B = [1,1,1,2,2,2] (separation)
Feature A has higher variance (more than 10x). Variance of projected data drives the ordering of PCs.
I'll add the coordinate limits to the ggplot - I use the customization options that you mention here. I've been using rlog transformed in my PCA plots, which I assume isn't an issue? Is the norm to use vst-transformed data for PCA plots?
I watched the StatQuest PCA video several times...and I'm still struggling to conceptualize calculation of PC1 for 6 samples with thousands of genes. The video stops at 3 genes, which conveniently can be assigned to the x, y, and z axis. Six points, representing samples, are plotted. Got it. But how do you find PC1 when there are thousands of genes/dimensions. I can't visualize how the six sample-points would be plotted in thousands of dimensions so that the line of best fit (PC1) could be determined... =/
He says "if we had more genes, we'd would just keep finding more and more PCs by adding perpendicular lines and rotating them...". It sounds simple, but I'm not getting it.
After I understand that, I need to calculate the remaining PCs (PC4 - PC6, since this example as 6 samples). I have no idea how you calculate PC4, which should be perpendicular to PC1, PC2, and PC3? ... which does not seem possible? I think this is where dimension reduction occurs - by rotating PC1 and PC2 to become the new X and Y axis? Then the new line of best fit would be PC3, PC4 would be the perpendicular line to PC3, and PC5 would be perpendicular to both PC3 and PC4?
Thanks for any help ... I'm lost.
VST or rlog are both fine.
I don't think I have time to work through PCA here, and I would recommend that you instead work through the many resources that have been listed.