Entering edit mode

I am trying to plot a volcano plot and highlight genes from multiple lists using colCustom.
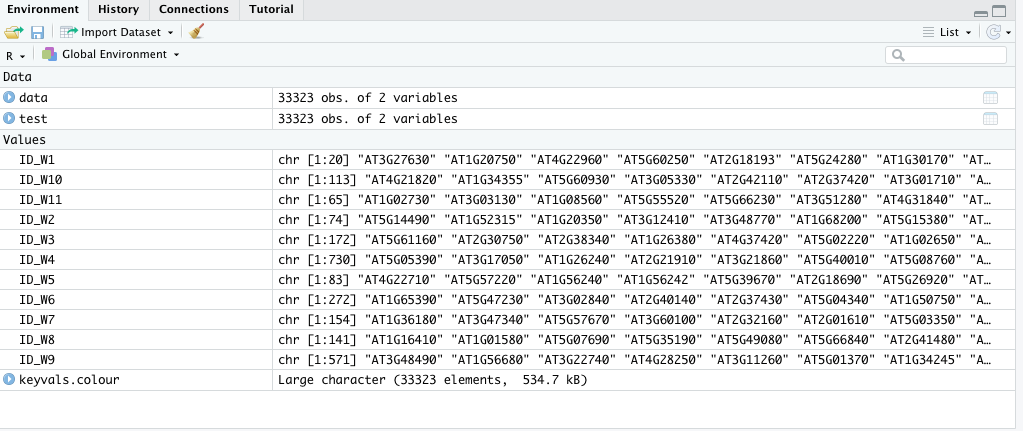
My data looks as follows with 33323 rows.
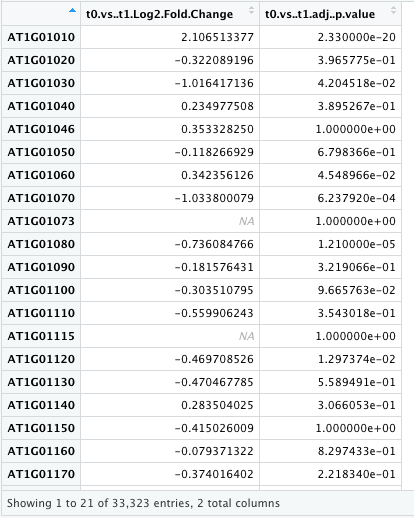
I have 11 lists, ID_W1-11, each containing a list of genes. I would like to color genes from each list a different color in the volcano plot.
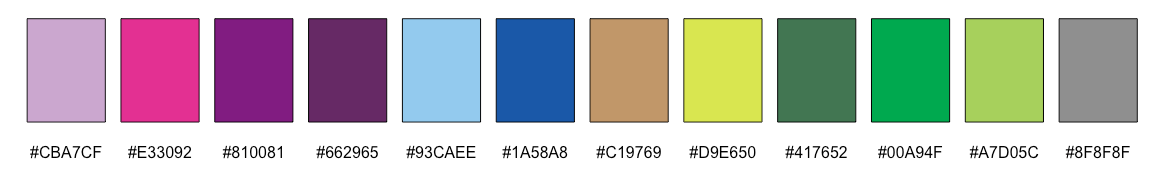
So I generated keyvals.colour to use colCustom with EnhancedVolcano as follows
keyvals.colour <- ifelse(rownames(data) %in% ID_W1, "#CBA7CF",
                     ifelse(rownames(data) %in% ID_W2, "#E33092",
                            ifelse(rownames(data) %in% ID_W3, "#810081",
                                   ifelse(rownames(data) %in% ID_W4, "#662965",
                                          ifelse(rownames(data) %in% ID_W5, "#93CAEE",
                                                 ifelse(rownames(data) %in% ID_W6, "#1A58A8",
                                                        ifelse(rownames(data) %in% ID_W7, "#C19769",
                                                               ifelse(rownames(data) %in% ID_W8, "#D9E650",
                                                                      ifelse(rownames(data) %in% ID_W9, "#417652",
                                                                             ifelse(rownames(data) %in% ID_W10, "#00A94F",
                                                                                    ifelse(rownames(data) %in% ID_W11, "#A7D05C",
                                                                                           "#8F8F8F")))))))))))

keyvals.colour[is.na(keyvals.colour)] <- "#8F8F8F"
names(keyvals.colour)[keyvals.colour == "#CBA7CF"] <- 'W1'
names(keyvals.colour)[keyvals.colour == "#E33092"] <- 'W2'
names(keyvals.colour)[keyvals.colour == "#810081"] <- 'W3'
names(keyvals.colour)[keyvals.colour == "#662965"] <- 'W4'
names(keyvals.colour)[keyvals.colour == "#93CAEE"] <- 'W5'
names(keyvals.colour)[keyvals.colour == "#1A58A8"] <- 'W6'
names(keyvals.colour)[keyvals.colour == "#C19769"] <- 'W7'
names(keyvals.colour)[keyvals.colour == "#D9E650"] <- 'W8'
names(keyvals.colour)[keyvals.colour == "#417652"] <- 'W9'
names(keyvals.colour)[keyvals.colour == "#00A94F"] <- 'W10'
EnhancedVolcano(data,
lab = rownames(data),
x = 't0.vs..t1.Log2.Fold.Change',
y = 't0.vs..t1.adj..p.value',
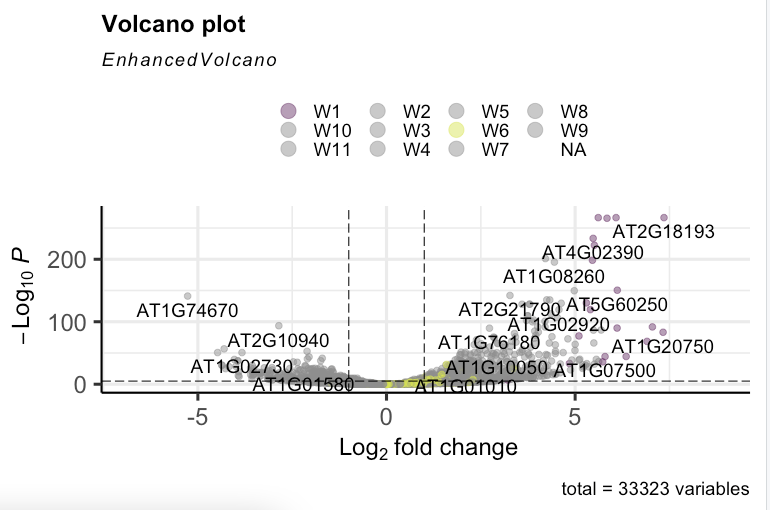
colCustom = keyvals.colour)
The resulting plot is not displaying all the selected colours.

Hi Kevin, When I run the function in my previous post, the only warning I get is the following..
I used EnhancedVolcano to highlight only 2 sets of genes and it works well. See below..
Neeraja
Hi, that's great that it works with a lower number of groups. Can you re-check the logic flow when you are using more groups? EnhancedVolcano should technically work for an infinite number of groups.
Regarding the warning, it just means that there are p-values of 0 in your dataset. As we cannot compute -log10(0), we have to impute these as non-zero values in order to include them in the plot. If your lowest non-zero p-value is 0.0004, then these will become 0.00004
Hi Kevin,
It worked once I added
names(keyvals.colour1)[keyvals.colour1 == '#8F8F8F'] <- 'NA'.Thanks a lot for your help!
Neeraja