Entering edit mode

Hi everyone,
disclaimer: I am very new to analysing mass spec data on R.
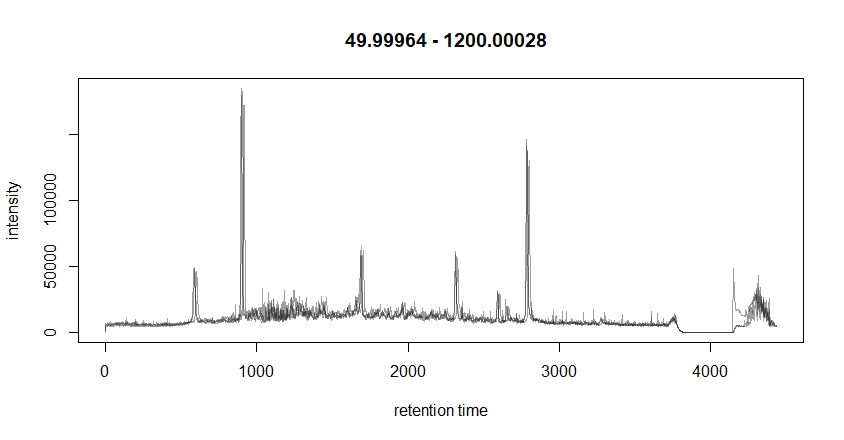
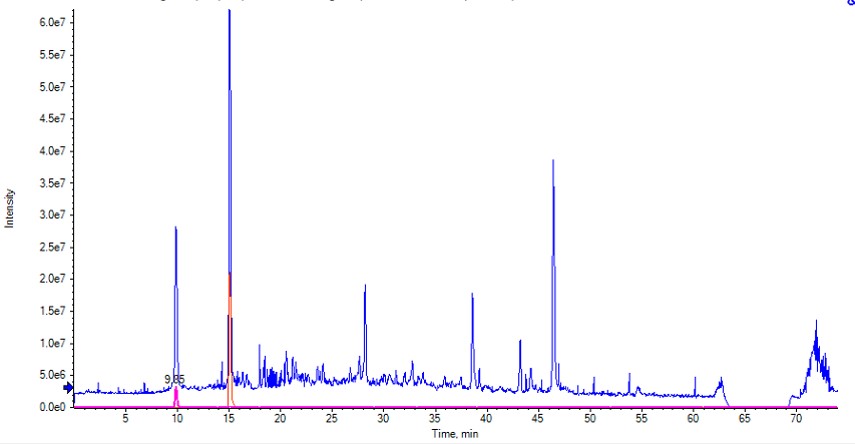
I would like to clarify why I see huge spectra intensity differences when comparing my initial TIC plot on using SCIEX PeakView versus TIC plotted using xcms package on R. My code is very simple and I am not using any transformation so I was wondering if there is an algorithm in the code that changes the data.
Thank you so much in advance!
library(xcms)

#upload 3 mzXML files stored in a cdf folder

cdfs <- list.files("./cdf", full.names = TRUE,
                   recursive = TRUE)


pd <- data.frame(sample_name = sub(basename(cdfs), pattern = ".CDF",
                                   replacement = "", fixed = TRUE),
                 sample_group = c(rep("Uro", 3)),
                 stringsAsFactors = FALSE)
pd

raw_data <- readMSData(files = cdfs, pdata = new("NAnnotatedDataFrame", pd),
                       mode = "onDisk")

head(rtime(raw_data))

mzs <- mz(raw_data)

mzs_by_file <- split(mzs, f = fromFile(raw_data))
length(mzs_by_file)

bpis <- chromatogram(raw_data, aggregationFun = "sum")

plot(bpis)