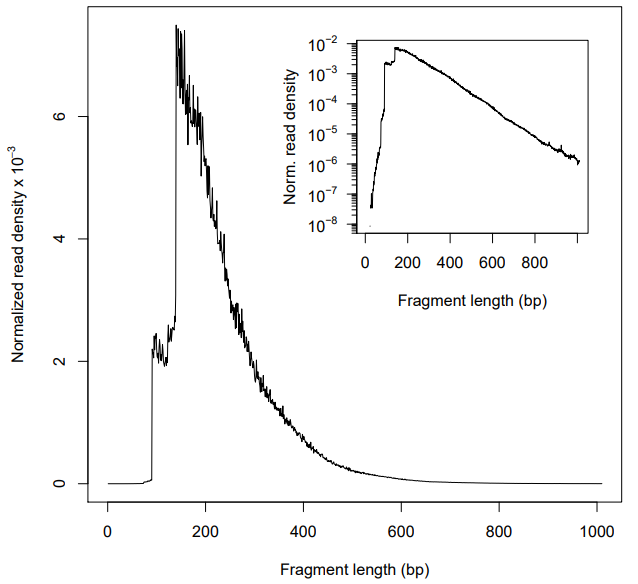
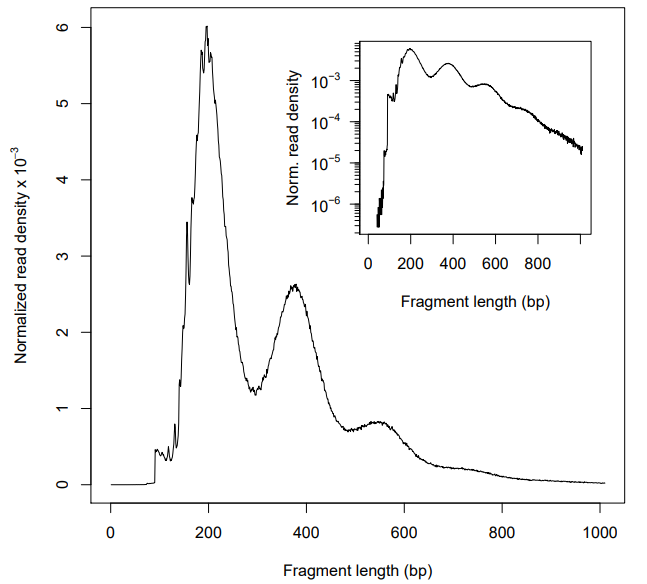
No peak corresponding to the nucleosome-free regions is observed in Fragment size distribution of ATAC-seq
3
0
Entering edit mode
@user-24527
Last seen 3.6 years ago
Hongkou

Hi,

I am studying the ATAC-seq data analysis pipeline recently. For the pre-alignment QC step, I used FastQC and trimmomatic tools. Then more than half of the reads were reserved and mapped to the reference genome using Bowtie2. After sequence alignment, duplicated reads, mitochondrial reads, non-unique alignments and improperly mapped reads were filterd. To evaluate the quality metrics of ATAC-seq data, fragement size distribution plots were generated using ATACseqQC.

Typically, there should be a large proportion of reads with less than 100 bp, which represents the nucleosome-free region. However, in my plots, the highest peaks is not in 50~100 bp but 200 bp, which corresponds to where Tn5 inserted around a single nucleosome. And I observed that in both two biological replicates, no matter filtering or not. And I wonder Why this happend? Is there any wrong in my data processing?

Thanks in advance

Figure 1. Fragment size distribution before filtering (There are many mitochondrial reads)

enter image description here

Figure 2. Fragment size distribution after filtering

enter image description here


# include your problematic code here with any corresponding output 
# please also include the results of running the following in an R session 

sessionInfo( )
ATACseqQC Fragmentsizedistribution ATAC-seq • 4.4k views
ADD COMMENT
0
Entering edit mode

What is the read size of your experiment? What kind of alignment mode were you using? End to end or local alignment? Did you tried to switch the alignment mode? Looks like the fragment less than 100bp is missing from your bam file.

ADD REPLY
0
Entering edit mode

Thanks for your help. It worked when I switch the end-to-end mode to local. Before filtering step, indeed, the insert fragment distribution was start from ~100 bp (Figure 3). And the quality seemed good when I only removed the mitochondrial reads (Figure 4). However, as you can see in Figure 5, the first peak of ~100 bp disappeared again when I filtered multi-mapped reads (those with MAPQ < 30, using -q in SAMtools). Does it mean that most of the short fragment (~100 bp) are non-unique alignments? If so, how to explain it? Should I remain the non-unique alignments in my bam file?

Figure 3

enter image description here

Figure 4

enter image description here

Figure 5

enter image description here

ADD REPLY
0
Entering edit mode

Try to trim the read length to 50 or 30bp before mapping and see what will happen.

Jianhong.

ADD REPLY
0
Entering edit mode
Haibo Liu ▴ 20
@haibol2017-23658
Last seen 26 days ago
United States

Hello Xiaojie,

 Did the experimenter run a Bioanalyzer assay to check the size distribution of the libraries before sequencing? If so, could you see bands between 150-200 bp?  Another possibility was that the libraries were size selected, but the size selection is biased to large fragments.  
 Otherwise the only thing I can think of is that your trimming step remove reads <  ? bp. For trimmomatic setting of minimal length, you’d better set it to 38, which is the minimal fragment size generated by Tn-5 dimmer (https://www.ncbi.nlm.nih.gov/pmc/articles/PMC3046479/).

Best

Haibo

ADD COMMENT
0
Entering edit mode

Thanks for your answer. In fact the ATAC-seq data were download from the GEO database, so I have no information for the libraries. And the minimal length was set to 20 in the trimming step. My command is this:

trimmomatic PE -threads 6 -phred33  ${i}_1.fastq.gz ${i}_2.fastq.gz -baseout ${i}.fastq.gz ILLUMINACLIP:$adapterPath/NexteraPE-PE.fa:2:30:10 LEADING:3 TRAILING:3 HEADCROP:10 SLIDINGWINDOW:4:15 MINLEN:20

Although the ratio of the size of _1U.fastq and _1P.fastq file may reach 20~30% , most of the reads were remained for mapping.

ADD REPLY
0
Entering edit mode
Haibo Liu ▴ 20
@haibol2017-23658
Last seen 26 days ago
United States

the option "HEADCROP:10" is poisonous, which remove 10 bases from the 5' of each reads. For ATAC-seq data, the 5' ends represent the Tn5 insert sites, should not be trimmed. For 3' end of reads derived from small inserts, it contain adapter sequences, which should be trimmed. Make sure your NexteraPE-PE.fa is correct, the sequences of adapters are specified correctly. you can check the Trimmomatic log file to see the trimming effect.

If you use end-to-end alignment by Bowtie, then reads containing partial of adaptor sequences after trimming will have a poor mapping quality or even discarded due to global alignment is impossible. Local alignment is preferred for ATAC-seq data. Personally, I used BWA-mem.

mapping quality >30 might be too stringent. You can plot a histogram to see the MAPping quality distribution. You can refer to our publication: https://www.ncbi.nlm.nih.gov/pmc/articles/PMC5831847/, especially Suppl. File 1, and Bioc2020 conference presentation: https://haibol2016.github.io/ATACseqQCWorkshop/articles/ATACseqQC_workshop.html.

Haibo

ADD COMMENT
0
Entering edit mode

Thanks for your advance. I cut the 10 bases from the 5' of reads, because their proportion of each base showed in FastQC report were bad. And the adapters from Nextera transposase sequences, which later removed using NexteraPE-PE.fa, were also found by FastQC. Now I trimmed the reads again, without "HEADCROP:10" and as Jianhong suggested, trimming the read length to 50 . But there were little change compared with the previous results.

ADD REPLY
0
Entering edit mode
Haibo Liu ▴ 20
@haibol2017-23658
Last seen 26 days ago
United States

Then I have to say that it is because the sequencing data has poor base quality, which leads to lower mapping quality. you can relax the mapping quality cutoff to a much lower threshold. As I suggest before, you can plot a histogram to see the mapping quality distribution to decide the threshold.

Since you can get Figure 4, I think it will be fine to go ahead though you may not get accurate open chromatin regions. Especially, footprinting analysis might be not accurate.

Anyway, this is a data quality issue, not because of our package.

ADD COMMENT
0
Entering edit mode

Thanks a lot. As you point out, this should be a data quality issue and might have resulted from biased size selection during library preparation, which also mentioned in ATACseqQC (https://bmcgenomics.biomedcentral.com/articles/10.1186/s12864-018-4559-3#Sec4). Especially, using the same pipeline, I processed another ATAC-seq data downloaded from ENCODE database. However, the problem above did not occur.

ADD REPLY

Login before adding your answer.

Traffic: 983 users visited in the last hour
Help About
FAQ
Access RSS
API
Stats

Use of this site constitutes acceptance of our User Agreement and Privacy Policy.

Powered by the version 2.3.6