Hi,
I was wondering if I could have your advice regarding investigating possible outliers.
I have an RNAseq dataset from human cells for an experiment with a 2-factorial design for four groups: control, treatment A, treatment B, and treatmentA+treatmentB. I have 7 biological replicates in each group.
After performing exploratory and differential expression analyses, one sample is detected as a possible outlier. My question is on how to handle this outlier:
1) I could either remove it from the analysis (leaving me with 6 biological replicates left which should be enough) or I could leave it and use the replacement from DESeq2. If removing it, the dilemma is that I can't yet justify removing the sample: I have looked at the QC for the raw reads of that sample, as well as the stats from the alignment and can't seem to find any evident issue with it. If leaving it, how can I make sure the outlier is not skewing my results?
2) Am I missing other checks that could explain why this sample is so different and perhaps help justify removing it from the analysis? Or would the visual checks shown below be enough to justify discarding the sample from the analysis?
Analysis
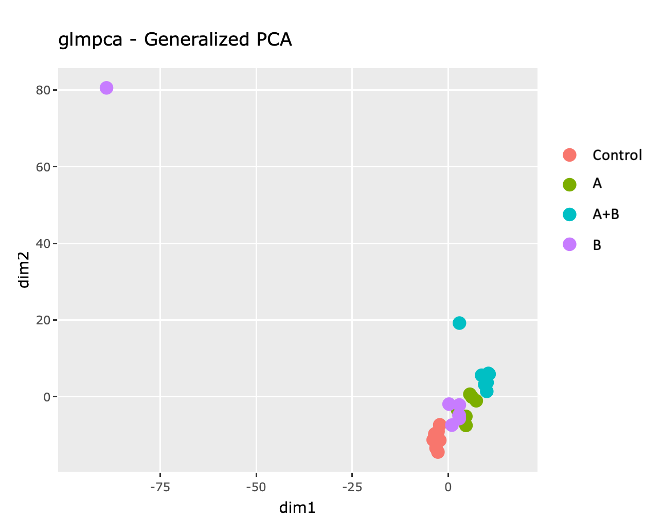
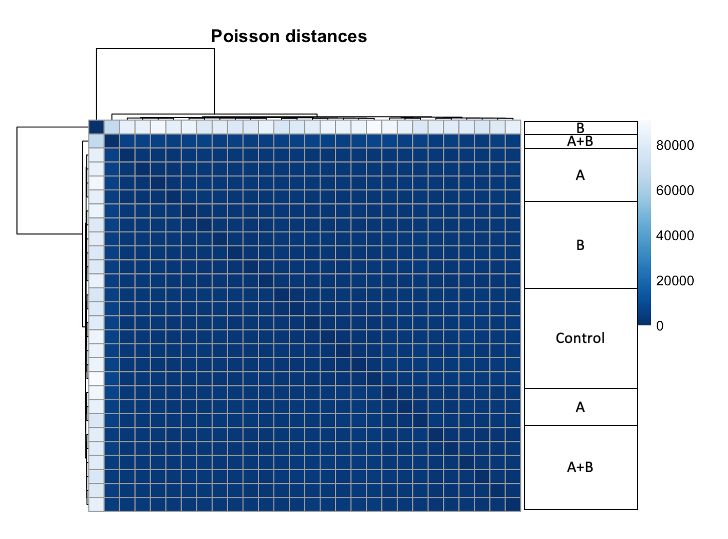
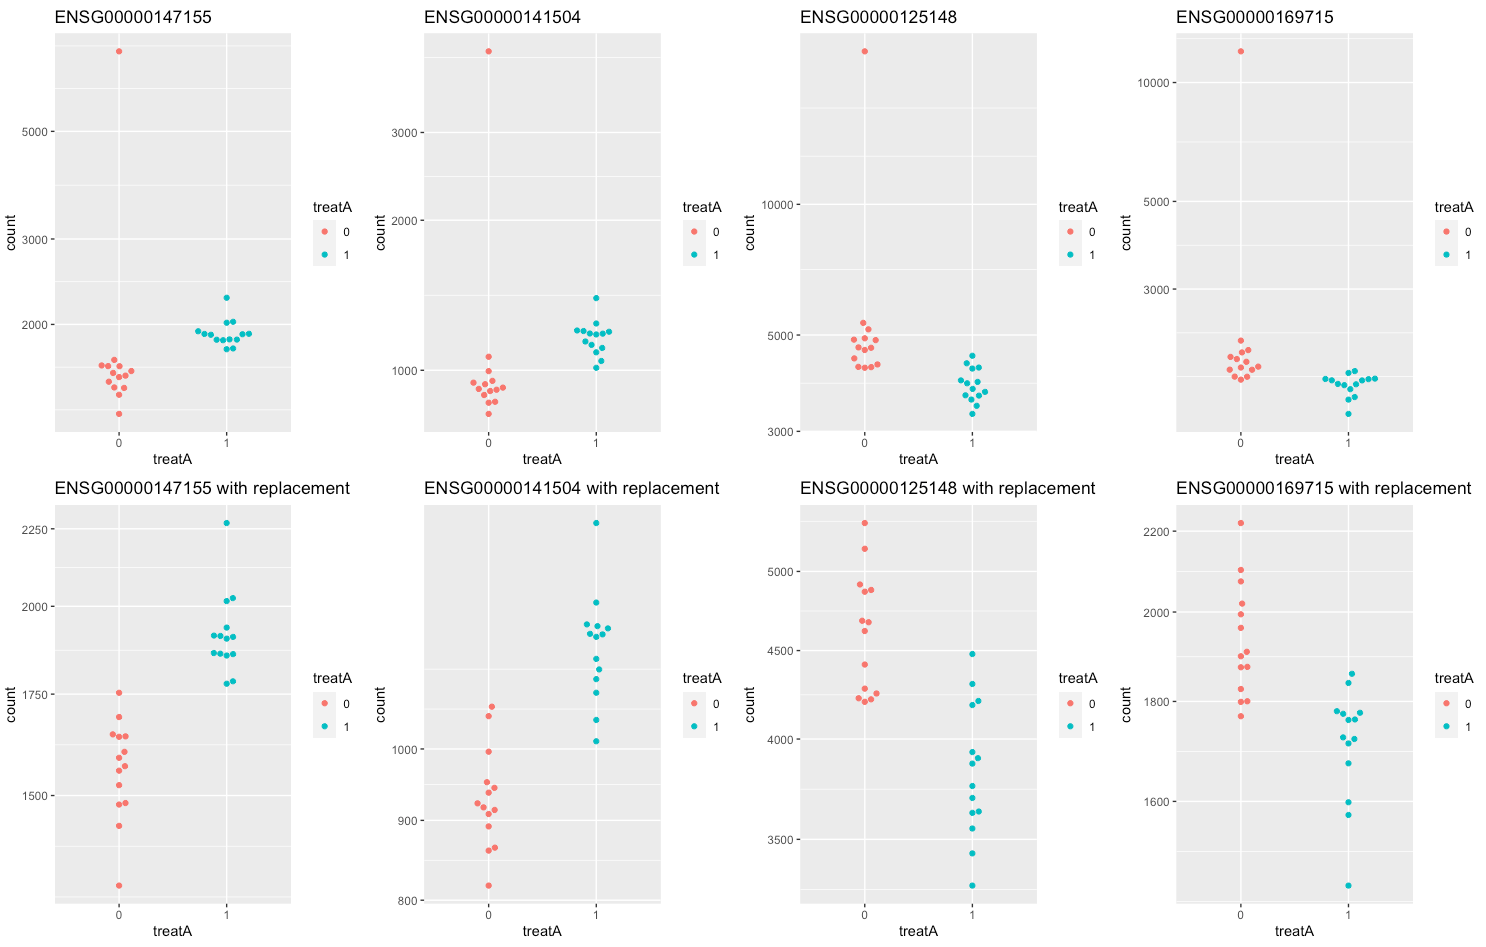
When looking at glmPCA and a heatmap using Poisson distances the outlier is very different from any other sample. I did a manual inspection of the sample, looked at the Cook Distances and the original and replaced counts (plots below) and it looks like that sample has very high counts for most of the 437 genes outliers detected by DESeq2 (I include 4 examples but I had checked all the values).
First, I'm testing for the effect of each treatment and these are the steps I'm following:
1) Create DESeq object. Two binary variables are used to test for the effect of A and B: treatA, which value is 1 if the sample was treated with A or A+B, and 0 otherwise; and treatB, which value is 1 if the sample was treated with B or A+B, and 0 otherwise. Then do pre-filtering to keep only genes with >10 in at least 7 samples.
dds <- DESeqDataSetFromMatrix(countData = countData, colData = metadata, design = ~treatA + treatB )

# Filter lowly expressed genes
keep <- rowSums(counts(dds) > 10) >= 7 # keep genes with at least 7 samples with a count of 10 or higher
dds <- dds[keep,]
2) GLM PCA, which shows that samples from the same group sort of cluster together, except from an outlier for B.
# GLM PCA
gpca <- glmpca(counts(dds), L=2)
gpca.dat <- gpca$factors
gpca.dat$Sample <- dds$Sample
gpca.dat$Treatment <- dds$Treatment
gpca.dat$Replicate <- dds$Replicate

pglmpca <- ggplot(gpca.dat, aes(x = dim1, y = dim2, color = Treatment, label = Replicate)) +
  geom_point(size =3) + coord_fixed() +
  ggtitle("glmpca - Generalized PCA, ")
ggplotly( pglmpca )
3) Heatmap of Poisson Distances shows that sample from B is very different from all other samples, regarding of their group.
# Heatmap, Poisson
poisd <- PoissonDistance(t(counts(dds)))
samplePoisDistMatrix <- as.matrix( poisd$dd )
colnames(samplePoisDistMatrix) <- NULL
colors <- colorRampPalette( rev(brewer.pal(9, "Blues")) )(255)

pheatmap(samplePoisDistMatrix,
         clustering_distance_rows = poisd$dd,
         clustering_distance_cols = poisd$dd,
         col = colors,
         main = Poisson distances")
4) Differential expression to test for the effect of treatment A. Using replacement, DESeq detects 436 outliers.
dds.rep <- DESeq(dds)
## -- replacing outliers and refitting for 436 genes

res.A <- results(dds.rep, contrast = c("treatA", "1", "0"))
summary(res.A)
##
## out of 17052 with nonzero total read count
## adjusted p-value < 0.1
## LFC > 0 (up)       : 602, 3.5%
## LFC < 0 (down)     : 528, 3.1%
## outliers [1]       : 0, 0%
## low counts [2]     : 1653, 9.7%
## (mean count < 14)
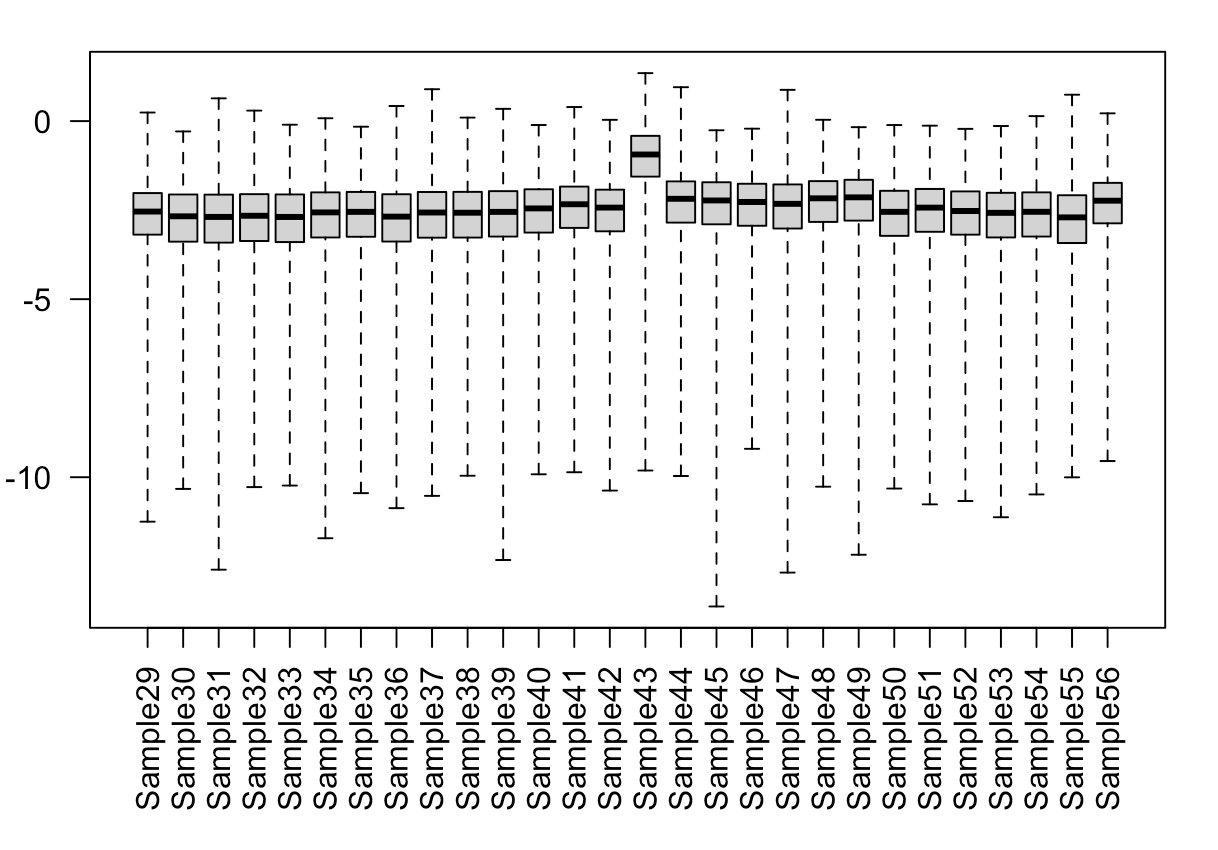
5) Boxplot of Cooks distances shows that sample 43 (this is the outlier) is consistently(ish) higher than the others.
par(mar=c(8,5,2,2))
boxplot(log10(assays(dds)[["cooks"]]), range=0, las=2)
6) Visual and manual inspection of outlier (sample 43).
# Running DESeq, turning off outlier detection and replacement
dds.norep <- DESeq(dds, minReplicatesForReplace = Inf)
res.A.norep <- results(dds.norep, contrast = c("treatA", "1", "0"), cooksCutoff = FALSE)
summary(res.A.norep)
# out of 17052 with nonzero total read count
# adjusted p-value < 0.1
# LFC > 0 (up)       : 586, 3.4%
# LFC < 0 (down)     : 513, 3%
# outliers [1]       : 0, 0%
# low counts [2]     : 662, 3.9%
# (mean count < 10)


# Comparing original counts vs replaced counts

# What genes changed p.value when turning off replacement?
Dif.no.rep <- (res.A$pvalue - res.A.norep$pvalue)
# indexes for the genes with replacement
g.rep.indx <- which(Dif.no.rep != 0)


# order outlier genes according to their pvalue (when using filtering and replacement)
subset.res <- res.A[g.rep.indx,]
subset.res.sorted <- subset.res[order(subset.res$pvalue, decreasing = FALSE), ]

# Plot the (normalised) original counts vs the (normalised) replaced counts
#   Top 4 genes with smallest p.value when using replacement

# Original gene counts
topGene <- rownames(subset.res.sorted)[1]
normCounts <- plotCounts(dds.rep, gene = topGene, intgroup = c("treatA"), returnData = TRUE)
plot1 <- ggplot(normCounts, aes(x = treatA, y = count, color = treatA)) +
  scale_y_log10() +  geom_beeswarm(cex = 3) +
  ggtitle(topGene)

# counts with replacement
normCounts <- plotCounts(dds.rep, gene = topGene, intgroup = c("treatA"), replaced = TRUE, returnData = TRUE)
plot2 <- ggplot(normCounts, aes(x = treatA, y = count, color = treatA)) +
  scale_y_log10() +  geom_beeswarm(cex = 3) +
  ggtitle(paste0(topGene, " with replacement"))

# [...] similar code goes for the top 3 genes
The top row of the figure shows the original counts for the 4 outlier genes with smaller p.values. The bottom row shows the same genes with their replaced counts.
Any advice on how to proceed would be very much appreciated. Thank you!
And my sessionInfo:
> sessionInfo()
R version 4.0.3 (2020-10-10)
Platform: x86_64-apple-darwin17.0 (64-bit)
Running under: macOS Big Sur 10.16

Matrix products: default
LAPACK: /Library/Frameworks/R.framework/Versions/4.0/Resources/lib/libRlapack.dylib

locale:
[1] en_GB.UTF-8/en_GB.UTF-8/en_GB.UTF-8/C/en_GB.UTF-8/en_GB.UTF-8

attached base packages:
[1] parallel  stats4    stats     graphics  grDevices utils     datasets  methods   base

other attached packages:
 [1] pheatmap_1.0.12             patchwork_1.1.1             forcats_0.5.1               stringr_1.4.0
 [5] dplyr_1.0.5                 purrr_0.3.4                 readr_1.4.0                 tidyr_1.1.3
 [9] tibble_3.1.0                tidyverse_1.3.0             plotly_4.9.3                ggpubr_0.4.0
[13] knitr_1.31                  ashr_2.2-47                 ggbeeswarm_0.6.0            PoiClaClu_1.0.2.1
[17] glmpca_0.2.0                magrittr_2.0.1              readxl_1.3.1                gplots_3.1.1
[21] RColorBrewer_1.1-2          apeglm_1.12.0               EnhancedVolcano_1.8.0       ggrepel_0.9.1
[25] ggplot2_3.3.3               geneplotter_1.68.0          annotate_1.68.0             XML_3.99-0.6
[29] AnnotationDbi_1.52.0        lattice_0.20-41             DESeq2_1.30.1               SummarizedExperiment_1.20.0
[33] Biobase_2.50.0              MatrixGenerics_1.2.1        matrixStats_0.58.0          GenomicRanges_1.42.0
[37] GenomeInfoDb_1.26.7         IRanges_2.24.1              S4Vectors_0.28.1            BiocGenerics_0.36.0
[41] biomaRt_2.46.3              edgeR_3.32.1                limma_3.46.0

loaded via a namespace (and not attached):
  [1] backports_1.2.1        BiocFileCache_1.14.0   plyr_1.8.6             lazyeval_0.2.2         splines_4.0.3
  [6] crosstalk_1.1.1        BiocParallel_1.24.1    digest_0.6.27          invgamma_1.1           htmltools_0.5.1.1
 [11] SQUAREM_2021.1         fansi_0.4.2            memoise_2.0.0          openxlsx_4.2.3         modelr_0.1.8
 [16] extrafont_0.17         extrafontdb_1.0        askpass_1.1            bdsmatrix_1.3-4        prettyunits_1.1.1
 [21] colorspace_2.0-0       rvest_1.0.0            blob_1.2.1             rappdirs_0.3.3         haven_2.3.1
 [26] xfun_0.22              crayon_1.4.1           RCurl_1.98-1.3         jsonlite_1.7.2         genefilter_1.72.1
 [31] survival_3.2-10        glue_1.4.2             gtable_0.3.0           zlibbioc_1.36.0        XVector_0.30.0
 [36] DelayedArray_0.16.3    proj4_1.0-10.1         car_3.0-10             Rttf2pt1_1.3.8         maps_3.3.0
 [41] abind_1.4-5            scales_1.1.1           mvtnorm_1.1-1          DBI_1.1.1              rstatix_0.7.0
 [46] Rcpp_1.0.6             viridisLite_0.3.0      xtable_1.8-4           progress_1.2.2         emdbook_1.3.12
 [51] foreign_0.8-81         bit_4.0.4              truncnorm_1.0-8        htmlwidgets_1.5.3      httr_1.4.2
 [56] ellipsis_0.3.1         farver_2.1.0           pkgconfig_2.0.3        dbplyr_2.1.1           locfit_1.5-9.4
 [61] utf8_1.2.1             labeling_0.4.2         tidyselect_1.1.0       rlang_0.4.10           munsell_0.5.0
 [66] cellranger_1.1.0       tools_4.0.3            cachem_1.0.4           cli_2.4.0              generics_0.1.0
 [71] RSQLite_2.2.6          broom_0.7.6            evaluate_0.14          fastmap_1.1.0          yaml_2.2.1
 [76] fs_1.5.0               bit64_4.0.5            zip_2.1.1              caTools_1.18.2         ash_1.0-15
 [81] ggrastr_0.2.3          xml2_1.3.2             compiler_4.0.3         rstudioapi_0.13        beeswarm_0.3.1
 [86] curl_4.3               ggsignif_0.6.1         reprex_2.0.0           stringi_1.5.3          highr_0.8
 [91] ggalt_0.4.0            Matrix_1.3-2           vctrs_0.3.7            pillar_1.6.0           lifecycle_1.0.0
 [96] BiocManager_1.30.12    data.table_1.14.0      cowplot_1.1.1          bitops_1.0-6           irlba_2.3.3
[101] R6_2.5.0               rio_0.5.26             KernSmooth_2.23-18     vipor_0.4.5            MASS_7.3-53.1
[106] gtools_3.8.2           assertthat_0.2.1       openssl_1.4.3          withr_2.4.1            GenomeInfoDbData_1.2.4
[111] hms_1.0.0              grid_4.0.3             coda_0.19-4            rmarkdown_2.7          carData_3.0-4
[116] mixsqp_0.3-43          bbmle_1.0.23.1         lubridate_1.7.10       numDeriv_2016.8-1.1


Hi Michael,
Thanks a lot for the feedback! GC content seems to be reasonable with 49.5%. However, this sample has the highest duplication error, 25.3%. I missed that but I guess that's an indication that something is not quite right with this sample.
Thanks again!