Hi Everyone:
I want to analyze 5hmC(from hMeDIP-seq) with DiffBind. I want to analyse both Narrow and Broad peaks for 5hmC. I have some questions:
1. Best way to call Narrow/Broad peaks? Using MACS2 with --broad or SICER?
Previously I have used MACS2 for narrowPeak, so initially I am trying to MACS2 again, with --broad parameter. However, after calling, I think the "broad" peaks are quite similar to "narrow" peaks, by checking .narrowPeak and .broadPeak files. Also, after searching around, some researchers suggested SICER, then I tried it, the result looks better in my IGV plot (below).
In the below plot, the first two raws are Narrow/Broad peaks from same sample, calling against Input. The codes are:
macs2 callpeak -t  boundBamPath -c  inputBamPath -f BAM -g 3.0e9 --outdir macs2 -n NC24_Bnd_Away -B -q 0.1 # For narrow peak
macs2 callpeak --broad --broad-cutoff 0.05 -t  boundBamPath -c  inputBamPath -f BAM -g 3.0e9 --outdir macs2 -n NC24_Bnd_Away -B -q 0.1 # For broad peak
Also I paste my SICER code below, which generated the last row in below IGV plot (I don't know why it was put here):
sicer -t boundBamPath -c inputBamPath -s hg38 -w 200 -rt 1 -f 150 -egf 0.74 -fdr 0.05 -g 600 -e 1000 -o sicer

So here comes my first question: Why the Broad peak from MACS2 are so similar with Narrow peaks from MACS2? Should I set other parameters more than --broad?
2. How to use DiffBind to "normalize" between SICER and MACS2 results?
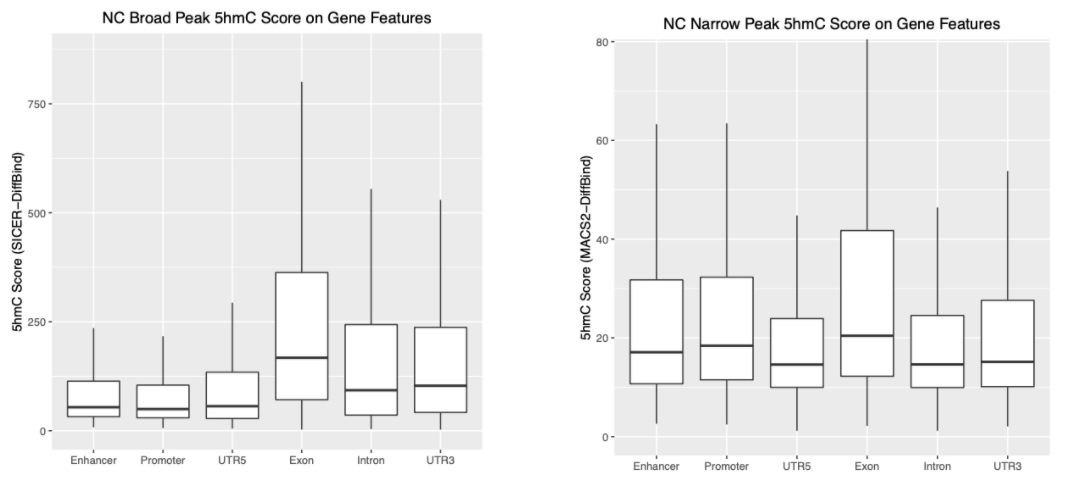
Assuming I will take SICER's Broad Peaks, and MACS2's Narrow Peaks. I have successfully loaded them with DiffBind separately, so I have now a DBA for NarrowPeaks (load with MACS2 .narrowPeak file), and a DBA for Broad Peaks (load with SICER .bed file). After some consensus peak count/normalisation (on narrow/broad DBA separately), and some matching, I get below two plots. The both y-axis in below plots are "5hmC value" I generated from the below code, but we can see the y-axis range varies a lot, because they are from different peak caller:
Narrow5hmCValue <- dba.peakset(myNarrowDBA, bRetrieve=TRUE) # So I get two 5hmC value matrix from narrow and broad DBAs separately.
Broad5hmCValue <- dba.peakset(myBroadDBA, bRetrieve=TRUE)
So here comes my second question: How can I compare/normalise the 5hmC value between Broad (from SICER) and Narrow (from MACS2) peaks?. These tools generated different format of data, and maybe their algorithm calculates the "Score" differently. How can I use DiffBind to "normalise" between them? If it's not possible, I hope I can find a better way to call the MACS2 broad peak, so that I can compare it with MACS2 narrow peak.
3. What is RPM over Input value for ChIP-SEQ?
Merely what I am trying to do now is similar to this paper's figure one. I did not quite get what is RPM over Input in Figure 1? I want to know how to generate this value with ChIP-SEQ data, since according to this plot, this RPM over Input value is comparable between different types of peaks
Personally, I think any "score" that can indicate "5hmC value" in chip data should be good to give me similar results. For example, my above boxplot looks a little bit similar to the Figure 1C, though the value is uncomparable between two plots, the trend of boxplot is what I am expecting. So I am not "insist" on any score like RPM over Input. However, I need to make sure the "Score" I use could be properly normalized between peak types, especially if the Narrow and Broad peaks are from different peak calling.
Sorry to post such a long and many questions, any small possible suggestion, code-debug, parameter-refine are very much welcome, and Thank You!


This post does not fit the theme of this forum.