
Hi!
I have questions in regards to how to set up my design/test for a time and dosage-response series with RNA-seq using DESeq2. Been following the example from the vignette and workflow (http://master.bioconductor.org/packages/release/workflows/vignettes/rnaseqGene/inst/doc/rnaseqGene.html#differential-expression-analysis).
My experiment has 89 samples (3-6 replicates per group): One cell line is differentiated and samples were collected at 4 time points (day 0, 6, 10 and 13). Cells were exposed to 4 different concentrations of a medication (50, 100, 200, 400 nM) throughout the experiment (except from day 0). I have looked at pairwise comparisons already, but also want to look at both the differences between control and treatment at different concentrations over time and dose-response at one given time-point.
Problem 1: To make the model full rank i removed day 0 samples, as they are only in the control group. This is the common start point for all groups, however treatment starts at day 1. Is this correct, or is there a way to include day 0 samples in the analysis?
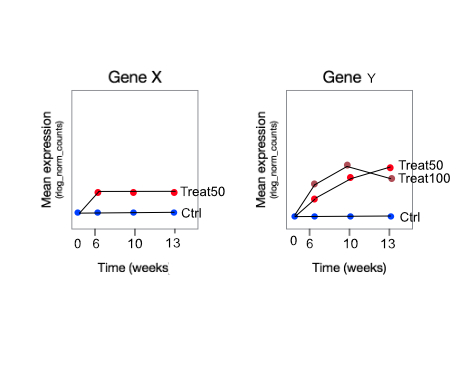
Problem 2: Time-response. Following the standard workflow as seen in code below. However, in the workflow there is only two groups (wt and mut), and I have 5 groups. I struggle with the interpretation of the results here. I would like to see genes that behave differently over time (day6 - 10 - 13) in a treatment group compared to control - (as in fig gene Y) is this what I will see? I understand the logFC will depend on the contrast, but the p-vals tells me that a gene at any concentration at any timepoint after 6 is expressed differently compared to untreated/control?
design = as.formula(~Concentration + Day + Concentration:Day)

dds <- DESeqDataSetFromMatrix(countData = counts,
                                   colData = target,
                                   design = design)

dds <- DESeq(dds, test="LRT", fitType = "local", reduced=~Concentration + Day)

resultsNames(dds)
 [1] "Intercept"              "Concentration_50_vs_0"  "Concentration_100_vs_0" "Concentration_200_vs_0"
 [5] "Concentration_400_vs_0" "Day_10_vs_6"            "Day_13_vs_6"            "Concentration50.Day10"
 [9] "Concentration100.Day10" "Concentration200.Day10" "Concentration400.Day10" "Concentration50.Day13"
[13] "Concentration100.Day13" "Concentration200.Day13" "Concentration400.Day13"
Problem 3: So here, say I use contrast interaction term "Concentration400.Day13" as below. Could you please spell out the logFC results for me - is this (day13_cons400 - day13_ctrl) - (day6_con400 - day6_ctrl)? I use Limma for similar methylation analysis, and find it easier to understand contrasts there, but would like to do this full analysis in DESeq2. What is the difference between the two contrasts below?
#1
res = results(dds2, name = "Concentration400.Day13", alpha = 0.05, independentFiltering = TRUE, cooksCutoff = TRUE, pAdjustMethod ="BH")

#2
res = results(dds2, contrast  = list(c("Day_13_vs_6", "Concentration400.Day13"), alpha = 0.05, independentFiltering = TRUE, cooksCutoff = TRUE, pAdjustMethod ="BH")
Problem 4: Is there a way of separating the effect of specific concentrations over time? What do the results mean if I only use Day in the reduced model?
dds <- DESeq(dds, test="LRT", fitType = "local", reduced=~Day)
Problem 5: How do I find genes that have the same gene expression pattern in treat vs control, but has higher or lower expression throughout the different timepoints, e.g, fig gene X? Can this be done with LRT, or do I have to intersect lists from group-wise comparisons?
Problem 6: I´d like to do the same analysis for dosage response: given one timepoint e.g day 6, which genes vary their expression with different treatment concentrations? Is this correct?
design = as.formula(~Day + Concentration + Day:Concentration)

dds<- DESeqDataSetFromMatrix(countData = counts,
                                   colData = target,
                                   design = design)

dds <- DESeq(dds, test="LRT", fitType = "local", reduced=~Concentration)
Sorry for the long post, any help will be greatly appreciated! Mari
