Entering edit mode

I am semi-new to R and bioinformatics, but I want to be able to customize the pathways that are shown in my dotplot after gseKEGG pathway analysis. Currently, only 15 or so pathways are differentially expressed according to this KEGG pathway analysis. However, I still want to show pathways that are not differentially enriched. I have attached what my current dotplot looks like, as well as the code for it, and a dot plot of what I want my data to look like. Any help would be greatly appreciated.
KEGG Pathway Analysis
#place ENSEMBL into ENTREZ id format
ids<-bitr(names(original_gene_list), fromType = "ENSEMBL", toType = "ENTREZID", OrgDb=organism)
dedup_ids = ids[!duplicated(ids[c("ENSEMBL")]),]
df2 = g[g$gene_id %in% dedup_ids$ENSEMBL,]
df2$Y = dedup_ids$ENTREZID
# Create a vector of the gene unuiverse
kegg_gene_list <- df2$log2FoldChange
#Name vector with ENTREZ ids
names(kegg_gene_list) <- df2$Y
head(df2$Y)
list(df2)
# omit any NA values
kegg_gene_list<-na.omit(kegg_gene_list)

# sort the list in decreasing order (required for clusterProfiler)
kegg_gene_list = sort(kegg_gene_list, decreasing = TRUE)
kegg_organism = "mmu"
kk2 <- gseKEGG(geneList     = kegg_gene_list,
               organism     = kegg_organism,
               nPerm        = 10000,
               minGSSize    = 5,
               maxGSSize    = 800,
               pvalueCutoff = 0.05,
               pAdjustMethod = "none",
               keyType       = "ncbi-geneid")
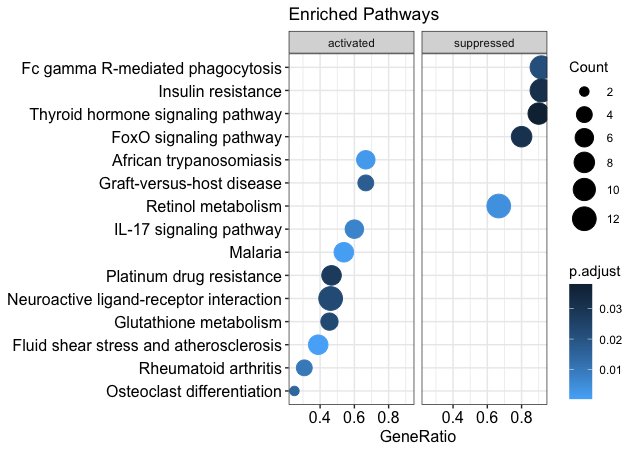
dotplot(kk2, showCategory = 10, title = "Enriched Pathways" , split=".sign") + facet_grid(.~.sign) + scale_color_gradient(low = "#56B1F7", high = "#132B43")
ridgeplot(kk2, showCategory = 30) + labs(title = "KEGG_Pathway Analysis", x = "enrichment distribution") + scale_fill_gradient(low = "#56B1F7", high = "#132B43")
This is what I currently have:
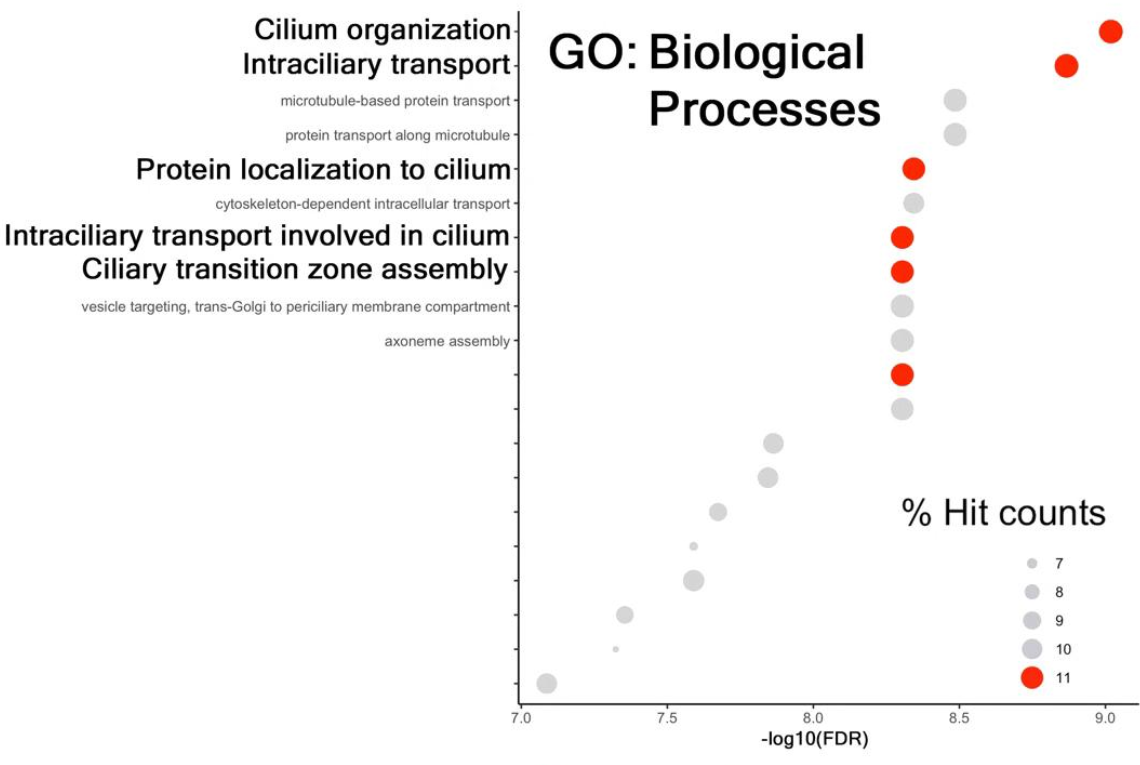
This is what I want it to look like (I will be looking at non-ciliary pathways, but hopefully you get the idea):