Entering edit mode

Hello Jianhong,
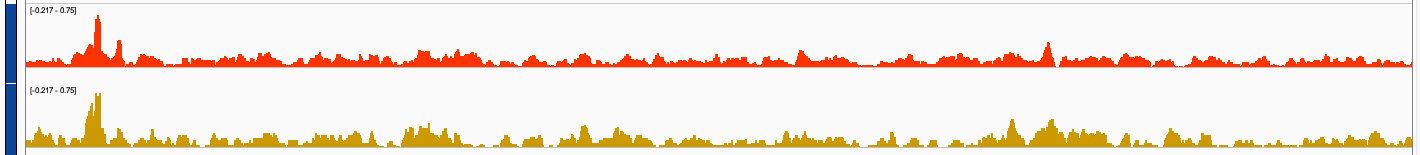
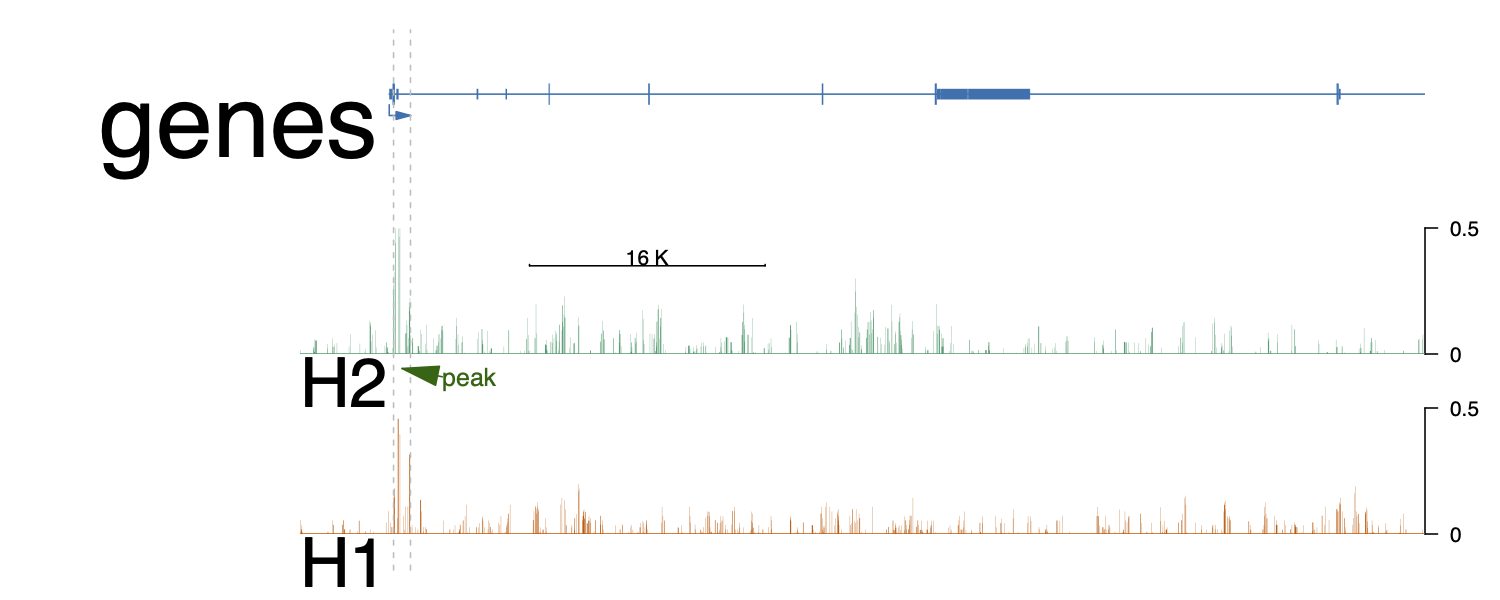
I wonder if trackViewer can smooth bigWig tracks if the bin-size to generate them is only, say, 20bp? Attached are screenshots of the same bigwig files visualized with trackviewer and IGV. IGV seem to produce smoother track visualization?
Thanks!
HA1 <- importScore(file = file.path(bwdir, 'x.bw'),
                   ranges = gr,
                    format="BigWig")
HA2 <- importScore(file = file.path(bwdir, 'y.bw'),
                   ranges = gr,
                    format="BigWig")
gr <- parse2GRanges("chr9:xx-xx:+")

library(TxDb.Hsapiens.UCSC.hg38.knownGene)
library(org.Hs.eg.db)
trs <- geneModelFromTxdb(TxDb.Hsapiens.UCSC.hg38.knownGene,
                         org.Hs.eg.db,
                         gr=gr)

ids <- getGeneIDsFromTxDb(gr, TxDb.Hsapiens.UCSC.hg38.knownGene)
ids <- "2395" # FXN
symbols <- mget(ids, org.Hs.egSYMBOL)
genes <- geneTrack(ids, TxDb.Hsapiens.UCSC.hg38.knownGene,
                   symbols, asList=FALSE)

optSty <- optimizeStyle(trackList(HA1, HA2, genes), theme="safe")
trackList <- optSty$tracks
viewerStyle <- optSty$style

setTrackViewerStyleParam(viewerStyle, "margin", c(.05, .2, .05, .05)) #bottom, left, top and right margin.
setTrackXscaleParam(trackList[[2]], "draw", TRUE)
setTrackXscaleParam(trackList[[2]], "gp", list(cex=0.8))
# setTrackXscaleParam(trackList[[2]], attr="position",
#                     value=list(x=xxx, y=2, label=1000))
setTrackViewerStyleParam(viewerStyle, "xaxis", FALSE) # disable x ticks
setTrackStyleParam(trackList[[1]], "ylim", c(0, 0.5))
setTrackStyleParam(trackList[[2]], "ylim", c(0, 0.5))


vp <- viewTracks(trackList,
                 gr=gr, viewerStyle=viewerStyle,
                 autoOptimizeStyle=TRUE)

addGuideLine(c(xxxx, xxxx), vp=vp) #peak1
addArrowMark(list(x=(xxxx + xxxx![enter image description here][1])/2,
                  y=2), # 2 means track 2 from the bottom.
             label="peak",
             col="darkgreen",
             vp=vp)

Thanks! Using deepTools with a different binSize solved the issue. Also, it seems only an issue I need to address when I'm plotting larger genome regions, e.g. the whole gene including introns. When I'm plotting the promotor region only, the default setting in deeptools (bin = 50 ) works pretty well.