
Hello,
I recently obtained some ChIP-seq data that I have attempted to analyse using ChIPseeker (v1.31.0). I am fairly new to R but the ChIPseeker tutorial was very easy to follow, however I am having issues with the code in the section "generating a profile of ChIP peaks binding to body regions".
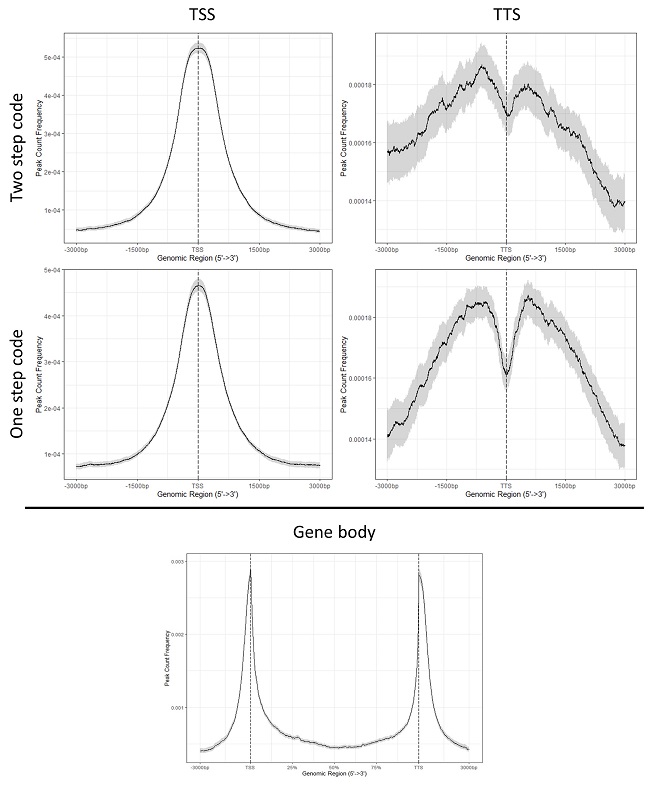
Specifically, I have a ChIP experiment using Pol II antibodies which generally show strong peaks at the TSS with not much at the TTS. Using the below codes I can replicate the expected result but I obtain slightly different profiles using either the two step or one step code. Firstly, any idea why the two versions of the code generate variable results and which would be more accurate to use?
# two step code
# replace type with "end-site" for TTS
TTS_matrix <- getTagMatrix(peak = PolII_narrow_peak,
                           TxDb = txdb,
                           upstream = 3000,
                           downstream = 3000,
                           type = "start_site",
                           by = "gene",
                           weightCol = "V5")

plotPeakProf(tagMatrix = TTS_matrix, conf = 0.95)

# one step code
# replace type with "end-site" for TTS
plotPeakProf2(PolII_narrow_peak, upstream = 3000, downstream = 3000, conf = 0.95,
              by = "gene", type = "start_site", TxDb = txdb,
              facet = "row")
Secondly, the main issue I'm running into is when I attempt to plot the gene body profile (same issue with or without flanks). Whereby I have similar looking peaks at both the TSS and TTS but they look mirrored. I have tried both the two step and one step method with the "flip_minor_strand" strand set to either T or F and they always produce the same profile. Also, changing the flanks from rel (0.2) (%) or stating n number of bases does not change the result.
# two step code
body_matrix <- getTagMatrix(peak = PolII_narrow_peak,
                           TxDb = txdb,
                           upstream = 3000,
                           downstream = 3000,
                           nbin = 800,
                           type = "body",
                           by = "gene",
                           weightCol = "V5",
                           flip_minor_strand = TRUE)

plotPeakProf(tagMatrix = body_matrix, conf = 0.95)

# one step code
plotPeakProf2(peak = PolII_narrow_peak, upstream = 3000, downstream = 3000,
              conf = 0.95, by = "gene", type = "body", nbin = 800,
              TxDb = txdb, weightCol = "V5", flip_minor_strand = TRUE)
I suspect the minor strand (-ve strand?) is not being flipped correctly (even with the option flip_minor_strand = T) so the start co-ordinates of minor strand genes are being used to TSS and end co-ordinates for TTS when it should be the other way round. Is there something wrong with the way I have typed my code in or missed an option? I have even used ChIPseeker v1.30.0 to see if it was a version specific problem but I still get the same result with the same codes. Any advice would be appreciated
Kind regards,
Will
Just realised that the answer to my first question is to do with the presence of weightCol = "V5" in the two part code. Adding the weightCol option to the one part code produced a profile similar to the two part code. The facet option in the one part code doesn't change the profile of the peaks, only the intensity.