Entering edit mode
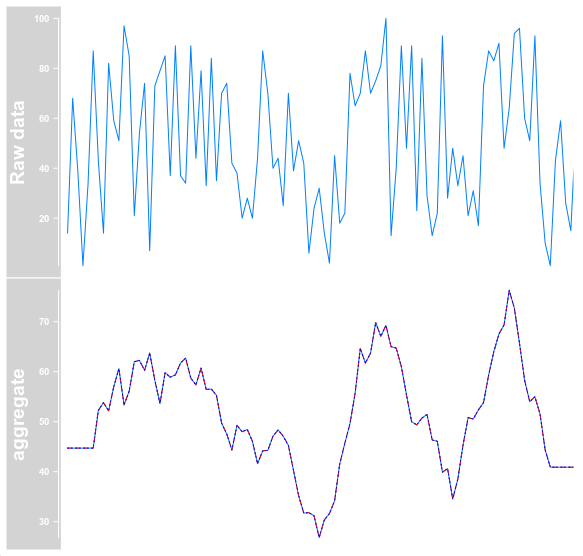
Using the Gviz library, I would like to transform data on the fly when plotting. This should be possible using the DataTrack arguments window, windowSize, and aggregation. However, it seems that the aggregation argument is set to "mean" and cannot be changed.
library(Gviz)

set.seed(0)
gr <- GRanges(seqnames = "chrI", ranges = IRanges(start = 1:100, width = 1), score = sample(x = 1:100, size = 100, replace = TRUE))

dt <- DataTrack(range = gr, type = "l", name = "Raw data")
dt_mean <- DataTrack(range = gr, type = "l", window = -1, windowSize = 11, aggregation = "mean", name = "aggregate")
dt_max <- DataTrack(range = gr, type = "l", window = -1, windowSize = 11, aggregation = "max", col = "red", lty = "dashed")
dt_min <- DataTrack(range = gr, type = "l", window = -1, windowSize = 11, aggregation = "min", col = "blue", lty = "dotted")

plotTracks(trackList = list(dt, OverlayTrack(trackList = list(dt_mean, dt_max, dt_min))), chromosome = "chrI")
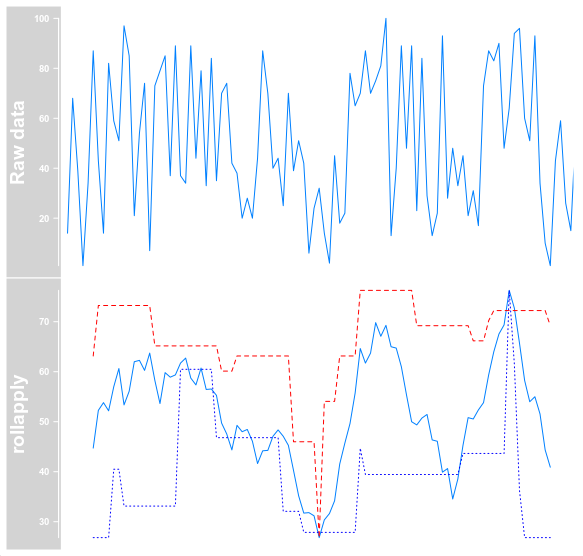
When I calculate min and max manually, I get the expected result.
library(zoo)

gr_mean <- gr
gr_mean$score <- rollapply(data = gr_mean$score, width = 11, FUN = mean, fill = NA)
dt_manual_mean <- DataTrack(range = gr_mean, type = "l", name = "rollapply")

gr_max <- gr
gr_max$score <- rollapply(data = gr_max$score, width = 11, FUN = max, fill = NA)
dt_manual_max <- DataTrack(range = gr_max, type = "l", col = "red", lty = "dashed")

gr_min <- gr
gr_min$score <- rollapply(data = gr_min$score, width = 11, FUN = min, fill = NA)
dt_manual_min <- DataTrack(range = gr_min, type = "l", col = "blue", lty = "dotted")

plotTracks(trackList = list(dt, OverlayTrack(list(dt_manual_mean, dt_manual_max, dt_manual_min))), chromosome = "chrI")
Am I missing something about how to correctly use the aggregation argument or is this a bug?
sessionInfo( )
# attached base packages:
# [1] grid      stats4    stats     graphics  grDevices utils     datasets  methods   base
# other attached packages:
# [1] zoo_1.8-9            Gviz_1.38.0          GenomicRanges_1.46.1 GenomeInfoDb_1.30.0  IRanges_2.28.0       S4Vectors_0.32.3     BiocGenerics_0.40.0


