Entering edit mode

Hi all and thank you for your help in advance.
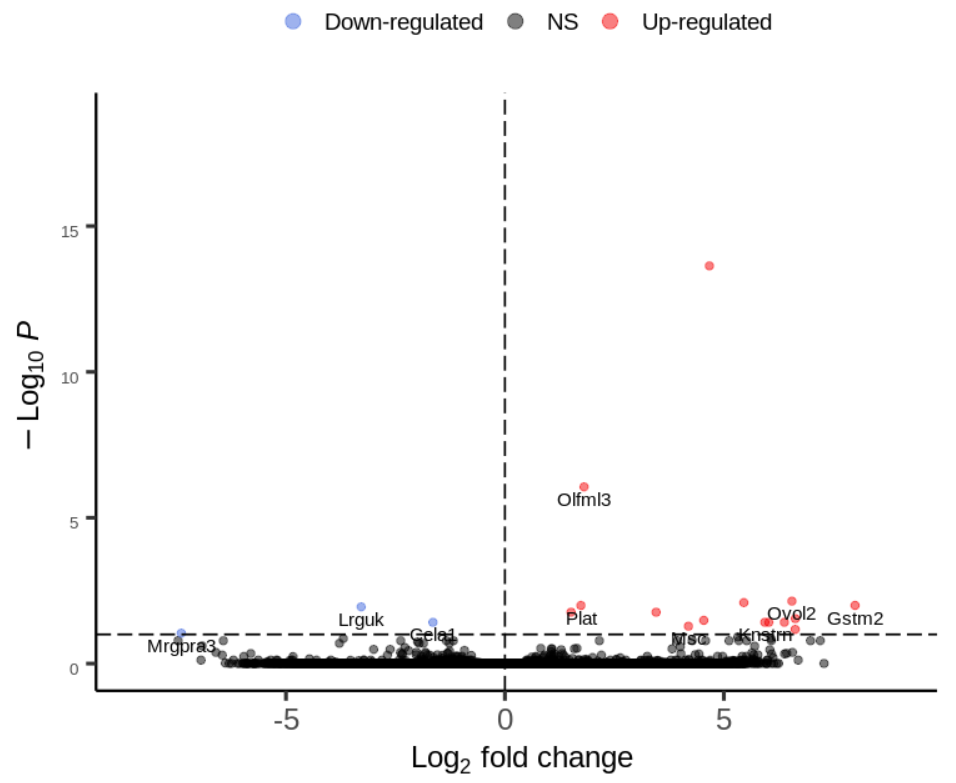
I am plotting the results of DESeq2 output using Enhanced Volcano package. I also want to plot only 20 gene labels.
My result table:
> head(resC3)
                 row  baseMean log2FoldChange    lfcSE        stat    pvalue      padj symbol                          geneName
1 ENSMUSG00000102693 1.5184259     -0.7800748 3.238902 -0.24084540 0.8096749 0.9920008   <NA>                              <NA>
2 ENSMUSG00000051951 4.4347206      0.7240531 1.907310  0.37962014 0.7042274 0.9896822   Xkr4 X-linked Kx blood group related 4
3 ENSMUSG00000102851 0.7409902     -3.2522220 3.440876 -0.94517258 0.3445708 0.9896822   <NA>                              <NA>
4 ENSMUSG00000103377 2.1128707      0.1741636 3.016754  0.05773211 0.9539620 0.9965102   <NA>                              <NA>
5 ENSMUSG00000104017 2.3202905      1.3844931 3.316122  0.41750370 0.6763100 0.9896822   <NA>                              <NA>
6 ENSMUSG00000103025 0.6405565      0.8586579 3.443174  0.24937975 0.8030670 0.9908850   <NA>                              <NA>
Rearrange the color:
keyvals.colour <- ifelse(
    resC3$log2FoldChange < 0 & resC3$padj < 0.1, 'royalblue',
      ifelse(resC3$log2FoldChange >= 0 & resC3$padj < 0.1, 'red2',
        'black'))
  keyvals.colour[is.na(keyvals.colour)] <- 'black'
  names(keyvals.colour)[keyvals.colour == 'red2'] <- 'Up-regulated'
  names(keyvals.colour)[keyvals.colour == 'black'] <- 'NS'
  names(keyvals.colour)[keyvals.colour == 'royalblue'] <- 'Down-regulated'
Select the labels to print:
selectLab<-resC3$symbol[names(keyvals.colour) %in% c('Up-regulated', 'Down-regulated')]
selectLab<-selectLab[!is.na(selectLab)]

str(selectLab)
chr [1:16] "Msc" "Knstrn" "Ovol2" "Olfml3" "Gstm2" "Lrrc17" "Oas1b" "Lrguk" "Tspan11" "Mrgpra3" "Plat" "Tmem184c" "Ppp2r1b" ...
Plot:
EC3<-EnhancedVolcano(resC3,
    subtitle = '',
    lab = resC3$symbol,
    x = 'log2FoldChange',
    y = 'padj',
    selectLab = selectLab,
    title = contrast,
    pCutoff = 0.0,
    FCcutoff = 0.0,
    pointSize = 2.0,
    labSize = 4.0,
    #col=c('grey30', 'grey30', 'royalblue', 'red2'),
    cutoffLineType = 'blank',
    cutoffLineCol = 'black',
    cutoffLineWidth = 0.8,
    hline = c(10e-2),
    hlineCol = c('black'),
    hlineType = c('longdash'),
    hlineWidth = c(0.6),
    vline = c(0),
    vlineCol = c('black'),
    vlineType = c('longdash'),
    vlineWidth = c(0.6),
    gridlines.major = FALSE,
    gridlines.minor = FALSE,
    colCustom = keyvals.colour) +
    theme(axis.text.y = element_text(size=10))
Only a few are plotted.
Could you help on this please? Many thanks.
sessionInfo( )

R version 4.0.0 (2020-04-24)
Platform: x86_64-pc-linux-gnu (64-bit)
Running under: CentOS Linux 7 (Core)

Matrix products: default
BLAS/LAPACK: /g/easybuild/x86_64/CentOS/7/haswell/software/OpenBLAS/0.3.9-GCC-9.3.0/lib/libopenblas_haswellp-r0.3.9.so

locale:
 [1] LC_CTYPE=en_US.UTF-8       LC_NUMERIC=C               LC_TIME=en_US.UTF-8        LC_COLLATE=en_US.UTF-8
 [5] LC_MONETARY=en_US.UTF-8    LC_MESSAGES=en_US.UTF-8    LC_PAPER=en_US.UTF-8       LC_NAME=C
 [9] LC_ADDRESS=C               LC_TELEPHONE=C             LC_MEASUREMENT=en_US.UTF-8 LC_IDENTIFICATION=C

attached base packages:
[1] parallel  stats4    stats     graphics  grDevices utils     datasets  methods   base

other attached packages:
 [1] ggbreak_0.0.8               biomaRt_2.44.1              DBI_1.1.0                   RSQLite_2.2.0
 [5] GO.db_3.11.4                mgsa_1.36.0                 EnhancedVolcano_1.6.0       ggrepel_0.8.2
 [9] knitr_1.28                  GGally_1.5.0                gridExtra_2.3               RColorBrewer_1.1-2
[13] GenomicFeatures_1.40.1      scales_1.1.0                reshape2_1.4.4              org.Mm.eg.db_3.11.4
[17] AnnotationDbi_1.50.1        pheatmap_1.0.12             gplots_3.0.3                genefilter_1.70.0
[21] ggplot2_3.3.0               DESeq2_1.28.1               SummarizedExperiment_1.18.2 DelayedArray_0.14.0
[25] matrixStats_0.56.0          Biobase_2.48.0              GenomicRanges_1.40.0        GenomeInfoDb_1.24.2
[29] IRanges_2.22.2              S4Vectors_0.26.1            BiocGenerics_0.34.0

loaded via a namespace (and not attached):
 [1] colorspace_1.4-1         ellipsis_0.3.0           XVector_0.28.0           aplot_0.1.1              rstudioapi_0.11
 [6] farver_2.0.3             bit64_0.9-7              fansi_0.4.1              splines_4.0.0            cachem_1.0.6
[11] geneplotter_1.66.0       Rsamtools_2.4.0          annotate_1.66.0          dbplyr_1.4.3             compiler_4.0.0
[16] httr_1.4.2               assertthat_0.2.1         Matrix_1.3-4             fastmap_1.0.1            cli_2.0.2
[21] htmltools_0.4.0          prettyunits_1.1.1        tools_4.0.0              gtable_0.3.0             glue_1.4.0
[26] GenomeInfoDbData_1.2.3   dplyr_0.8.5              rappdirs_0.3.1           Rcpp_1.0.4.6             vctrs_0.2.4
[31] Biostrings_2.56.0        gdata_2.18.0             rtracklayer_1.48.0       xfun_0.13                stringr_1.4.0
[36] lifecycle_0.2.0          gtools_3.8.2             XML_3.99-0.3             zlibbioc_1.34.0          hms_0.5.3
[41] yaml_2.2.1               curl_4.3                 memoise_2.0.0            ggfun_0.0.4              yulab.utils_0.0.4
[46] reshape_0.8.8            stringi_1.4.6            highr_0.8                caTools_1.18.0           BiocParallel_1.22.0
[51] rlang_0.4.5              pkgconfig_2.0.3          bitops_1.0-6             evaluate_0.14            lattice_0.20-41
[56] purrr_0.3.4              GenomicAlignments_1.24.0 patchwork_1.0.0          htmlwidgets_1.5.1        labeling_0.3
[61] bit_1.1-15.2             tidyselect_1.0.0         plyr_1.8.6               magrittr_1.5             R6_2.4.1
[66] pillar_1.4.3             withr_2.2.0              survival_3.1-12          RCurl_1.98-1.2           tibble_3.0.1
[71] crayon_1.3.4             KernSmooth_2.23-17       BiocFileCache_1.12.0     BisqueRNA_1.0.5          rmarkdown_2.11
[76] progress_1.2.2           locfit_1.5-9.4           grid_4.0.0               data.table_1.12.8        blob_1.2.1
[81] digest_0.6.25            xtable_1.8-4             gridGraphics_0.5-0       openssl_1.4.1            munsell_0.5.0
[86] ggplotify_0.1.0          askpass_1.1

Hi Kevin, Thanks for your reply. Here ate the requested output:
Thanks for your help.
It can be that there is no space to plot all labels. Can you try
drawConnectors = TRUEIt does the trick, thanks!