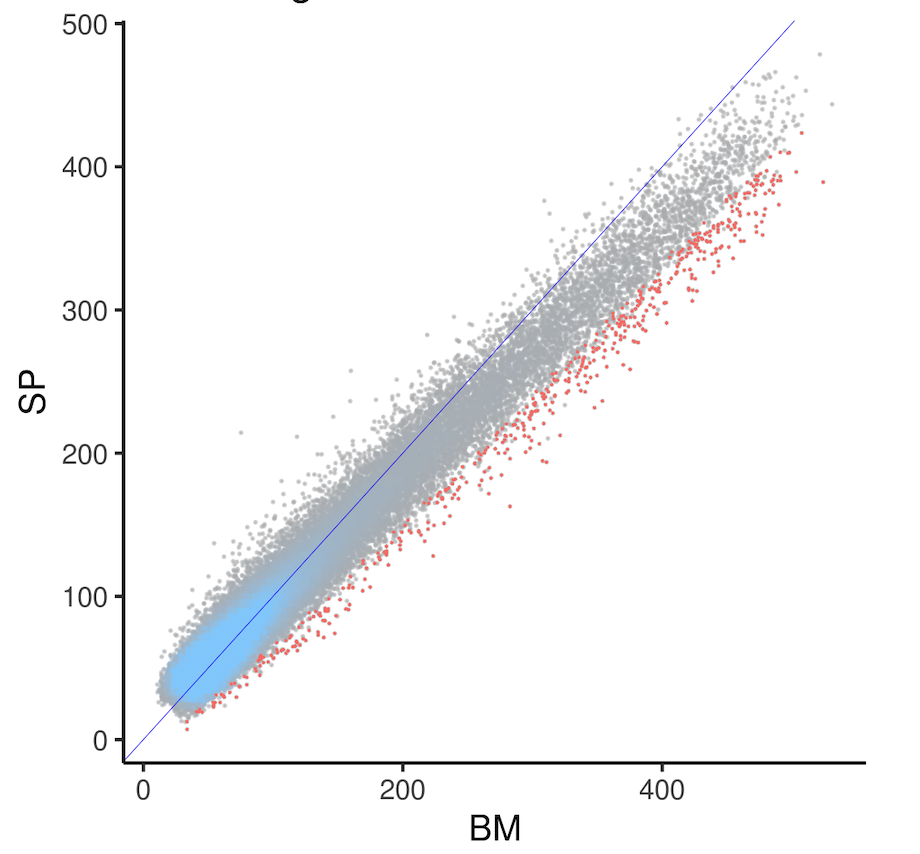
ATAC-seq samples from 2 different tissues were collected, with 2 replicates each, and normalized using DESeq2 estimateSizeFactors. The scatter plot below shows the normalized counts for each peak, with a blue color scale indicating point density where points are too dense to see. The mean of samples from each tissue (BM and SP) on x and y axes. The blue line indicates x~y. Unfortunately, at the higher end (the "tail"), most points (peaks) are below the y~x line, causing DESeq2 to identify many differentially accessible peaks higher in BM (DAPs, shown in red). The tilted tail most likely reflects a batch effect, because samples from the 2 tissues were collected from 2 independent batches of animals. We also have previous samples where samples from the 2 tissues were collected from the same animal at the same time, and the same scatter plot did not show the tail tilting issue.
I was wondering if there is a DESeq2 built-in on 3rd party method to correct/avoid the "drifted" tail?
Best, Changxu