Entering edit mode

Dear all,
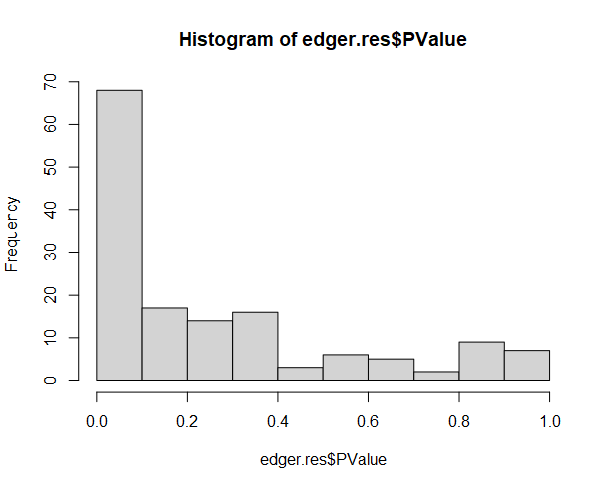
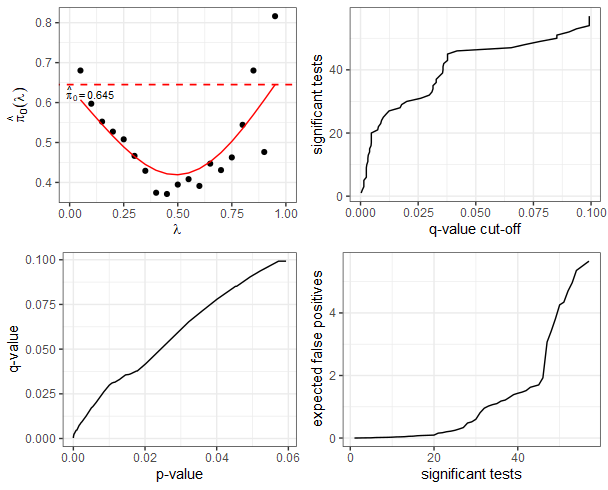
Based on the following paper by Dr. Hicks (https://www.ncbi.nlm.nih.gov/pmc/articles/PMC6547503/), I tried other ways to adjust for multiple testing. One algorithm that I am trying now is the qvalue package. With this package, I got way more statistically significant results compared to the conventional BH adjustment (p.adjust). Out of 147 tests, 57 are significant with qvalue and 15 with BH. Below is the histogram of my p-values and the plots from the q-value package. Does it look okay?
The p-value histogram looks OK to me. At least it doesn't have this U-shape. However, I am not sure about the other plots.
Your inputs are very much appreciated.