Entering edit mode

Hello,
I am trying to generate a dotplot from the enrichment analysis using clusterprofiler, but I keep getting the same error. It worked a week before and isn't working anymore so I'm assuming R updated the function? Is anyone else facing the same issue? I looked up the error and it's usually for an avg function which doesn't help too much. I am following a tutorial listed on this page: https://learn.gencore.bio.nyu.edu/rna-seq-analysis/gene-set-enrichment-analysis/
organism = "org.At.tair.db"
BiocManager::install(organism, character.only = TRUE)
library(organism, character.only = TRUE)

sorted_dfx <- cluster_df$coef20
names(sorted_dfx) <- cluster_df$cluster_df
sorted_dfx <- sort(sorted_dfx, decreasing = TRUE)


keytypes(org.At.tair.db)
gse <- gseGO(geneList=sorted_dfx,
             ont ="ALL",
             keyType = "TAIR",
             minGSSize = 3,
             maxGSSize = 800,
             pvalueCutoff = 0.05,
             verbose = TRUE,
             OrgDb = organism,
             by = "fgsea",
             pAdjustMethod = "none")


require(DOSE)
library(enrichplot)
library(DOSE)
edo2dot <- gseDO(sorted_dfx)
#barplot(gse, showCategory=10)
dotplot(gse, showCategory=10, split=".sign") + facet_grid(.~.sign)


# THE ERROR
> dotplot(gse, showCategory=10, split=".sign") + facet_grid(.~.sign)
Error in unique.default(x, nmax = nmax) :
  unique() applies only to vectors

### SORTED DFX
> head(sorted_dfx)
AT2G19990 AT1G30760 AT4G15160 AT5G10510 AT3G10870 AT4G00080
 4.979037  4.579719  4.236575  4.102173  4.017096  3.746760

###GSE
> gse
#
# Gene Set Enrichment Analysis
#
#...@organism    Arabidopsis thaliana
#...@setType     GOALL
#...@keytype     TAIR
#...@geneList    Named num [1:5772] 4.98 4.58 4.24 4.1 4.02 ...
 - attr(*, "names")= chr [1:5772] "AT2G19990" "AT1G30760" "AT4G15160" "AT5G10510" ...
#...nPerm    1e+05
#...pvalues adjusted by 'none' with cutoff <0.05
#...478 enriched terms found
'data.frame':   478 obs. of  12 variables:
 $ ONTOLOGY       : chr  "BP" "BP" "BP" "BP" ...
 $ ID             : chr  "GO:0009416" "GO:0009314" "GO:0097305" "GO:0010035" ...
 $ Description    : chr  "response to light stimulus" "response to radiation" "response to alcohol" "response to inorganic substance" ...
 $ setSize        : int  483 490 439 649 685 712 741 471 411 411 ...
 $ enrichmentScore: num  -0.562 -0.558 -0.559 -0.555 -0.537 ...
 $ NES            : num  -1.55 -1.54 -1.54 -1.54 -1.49 ...
 $ pvalue         : num  1e-05 1e-05 1e-05 1e-05 1e-05 ...
 $ p.adjust       : num  1e-05 1e-05 1e-05 1e-05 1e-05 ...
 $ qvalues        : num  0.000973 0.000973 0.000973 0.000973 0.000973 ...
 $ rank           : num  1450 1450 1627 1598 1627 ...
 $ leading_edge   : chr  "tags=45%, list=25%, signal=37%" "tags=44%, list=25%, signal=36%" "tags=54%, list=28%, signal=42%" "tags=50%, list=28%, signal=41%" ...
 $ core_enrichment: chr  "AT4G19230/AT3G03150/AT2G24100/AT2G18790/AT4G35510/AT2G02450/AT3G50830/AT2G17300/AT5G43260/AT1G25560/AT5G48150/A"| __truncated__ "AT4G19230/AT3G03150/AT2G24100/AT2G18790/AT4G35510/AT2G02450/AT3G50830/AT2G17300/AT5G43260/AT1G25560/AT5G48150/A"| __truncated__ "AT4G34990/AT3G51920/AT3G56880/AT3G19240/AT5G18310/AT5G39570/AT1G08800/AT1G35670/AT5G35735/AT1G64950/AT2G41230/A"| __truncated__ "AT5G39570/AT1G53790/AT2G22560/AT5G07800/AT5G04830/AT5G35735/AT1G64950/AT2G41230/AT1G08050/AT1G56160/AT1G16150/A"| __truncated__ ...
At which step exactly do you get this error?
What is the output of
head(sorted_dfx), andhead(gse)?Please note that your code is very confusing, because it seems you are working with data from Arabidopsis. Yet, your call to
gseGOuses the argumentOrgDb = organism. How isorganismdefined?In the next part of your code you rather use the function
gseDOon human data... Are you sure you intend do to this in the same analyses?Lastly, check the help page of the function
gseGO(type ?gseGO), because the use of the argumentnPermis not current anymore. Since functionality of the pakagefgseais nowadays used for GSEA analyses, you should use the argumentepsinstead.I apologize for the lack of clarity! I updated the post to reflect some of the questions you posed. I am trying to create the dotplot for arabidopsis genes and not for human data. I defined the organism at the start. Sorted_dfx is a numeric array with TAIR Ids of some genes ordered according to the logFC values. gseGO seems to be working so something seems to be wrong with the dotplot function. Is the dotplot working for you for sample data mentioned here: https://rdrr.io/bioc/enrichplot/man/dotplot.html
Yes, the dotplot worked for me with the sample data!
Yet, I can also not reproduce your error... though I noticed your object
gsewas not generated according to the code you posted! BecausenPermslot ofgseis not empty...!#...nPerm 1e+05whereas it should be empty when specifying the argumentby = "fgsea"(which is actually the default setting) .Anyway, below find some code + output of
enrichGOandgseGOfor Arabidsopsis. You should be able tor run everything yourselves as well, and modify settings according to your dataset and needs.As example, the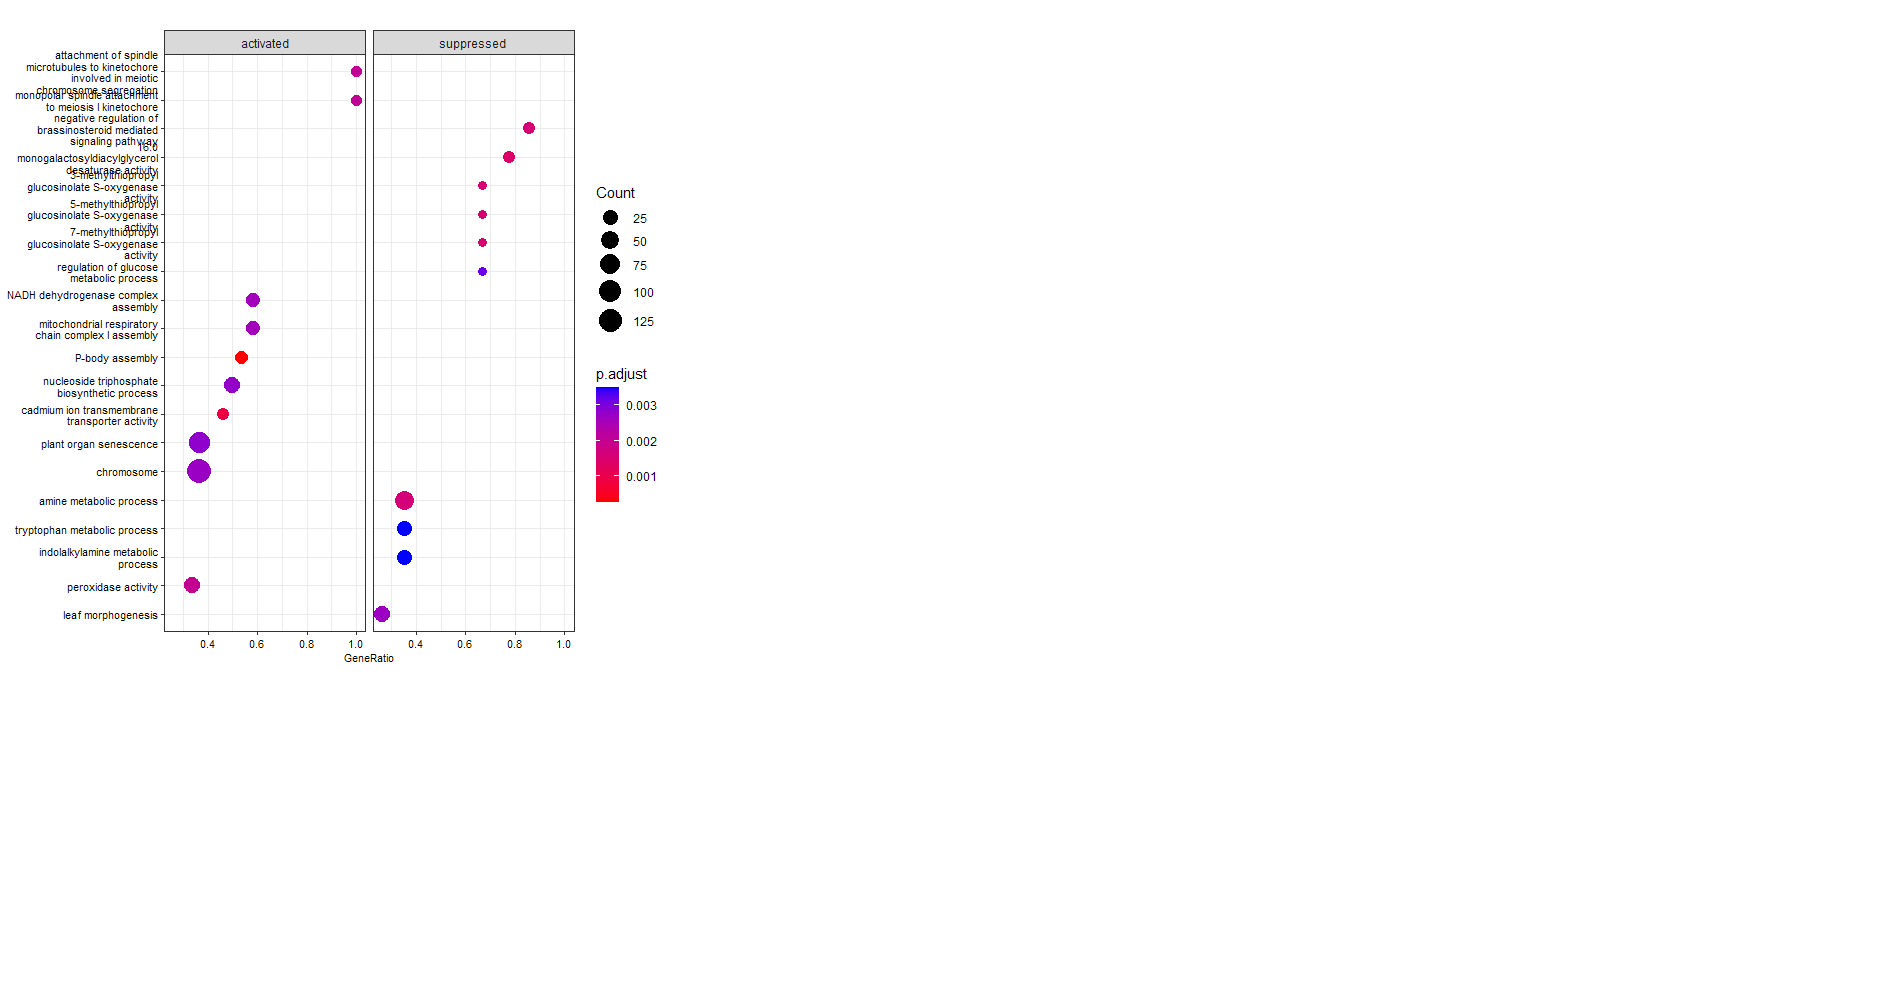
dotplotyou tried to generate:Also the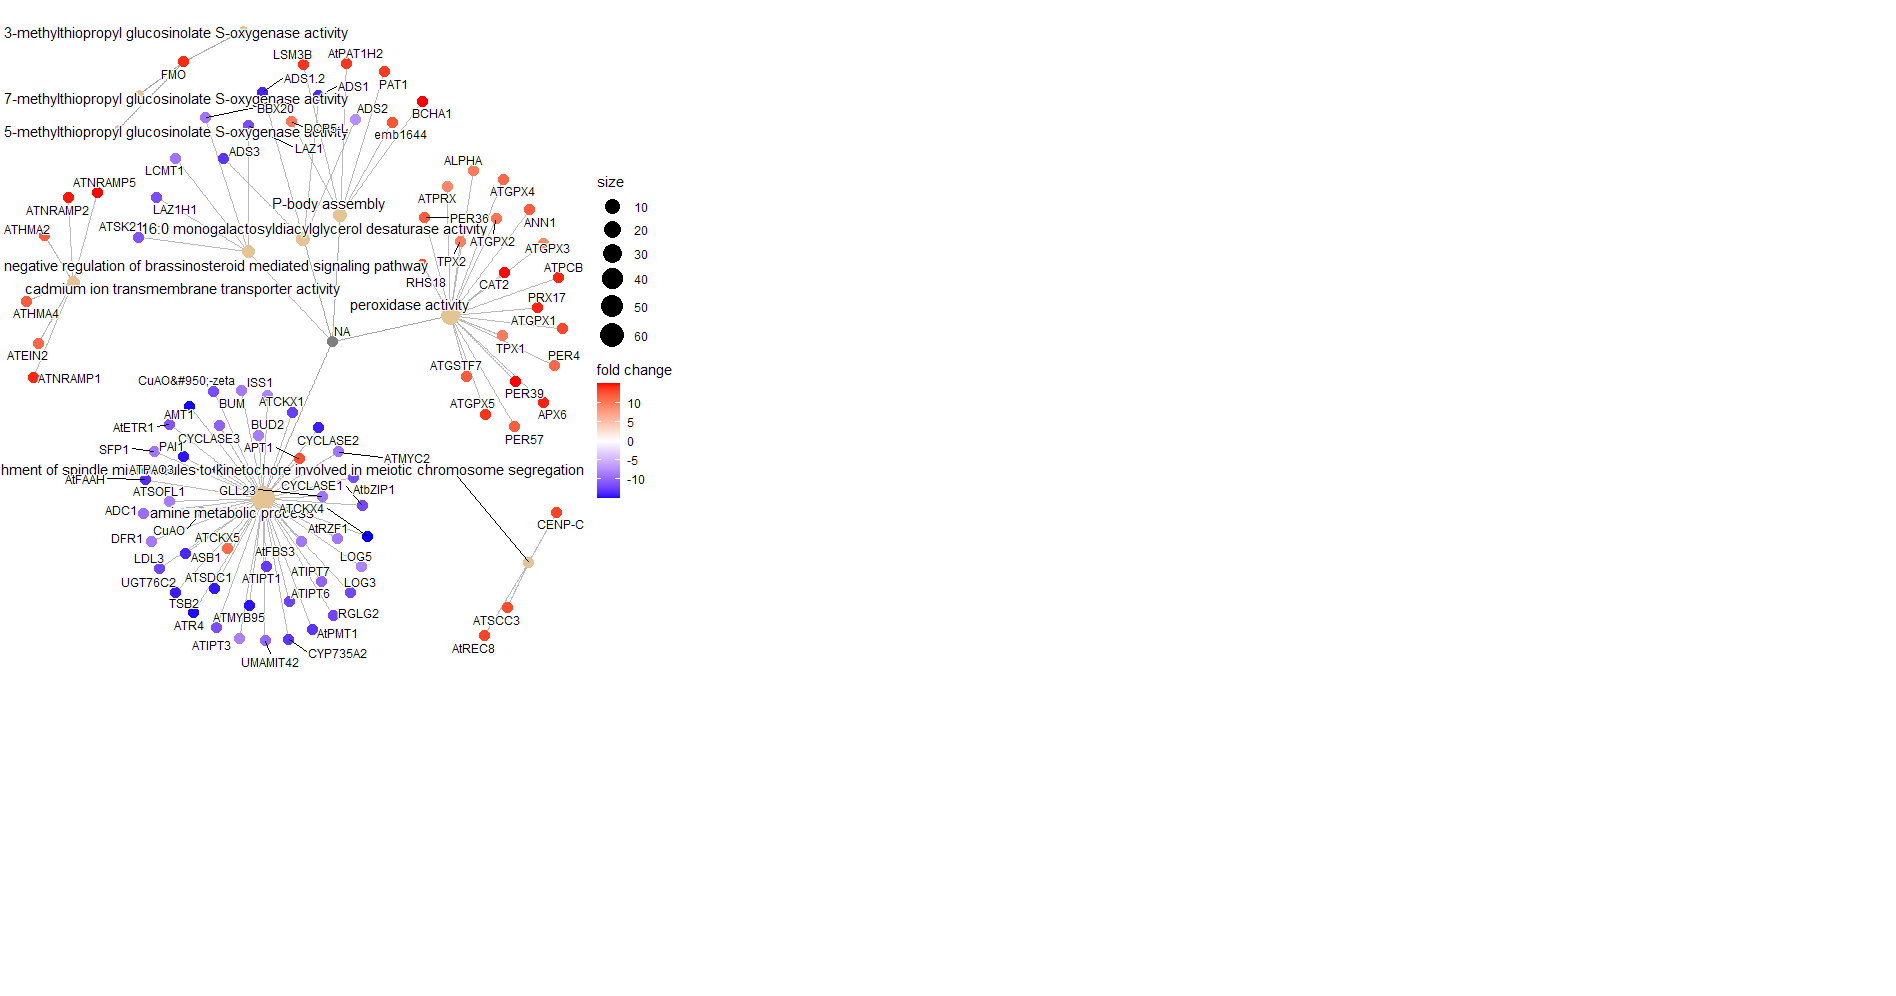
cnetplotfrom the GSEA run: