Entering edit mode

Hi Everyone!!
I am trying out a Package Gviz to make chromosome-wise coverage plot for a genome sequencing experiment. I was planning to plot per-chromosome-multi-sample coverage plot as shown below.
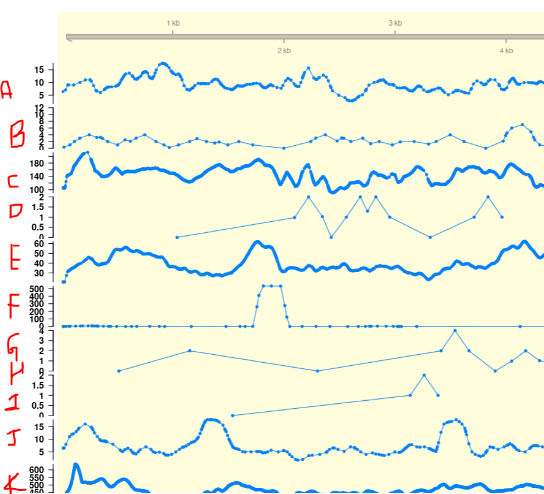
For that I have written a function that does that but now I wish to loop over that function and iteratively save the pdf. But I am unable to achieve that.
## Function
plotGenCov <- function(df, list.files, chr, labels=FALSE,regex="NEB.*",...){
  options(ucscChromosomeNames=FALSE)
  dtrack.all <- lapply(1:length(list.files), function(x){
    if(isFALSE(labels)){
    name <- gsub(regex,"",basename(list.files[x]))
    DataTrack(range = list.files[x], type = "l", window = -1, name = name)
    } else {
      name <- labels[x]
      DataTrack(range = list.files[x], type = "l", window = -1, name = name)
    }

  })
  t <- GRanges(df)
  gtrack<- GenomeAxisTrack(t[seqnames(t) == chr])
  plotTracks(trackList = c(list(gtrack),dtrack.all),
             chromosome = chr,
             from=as.data.frame(t[seqnames(t) == chr])$start,
             to=as.data.frame(t[seqnames(t) == chr])$end, cex.axis = 1, cex.title = 1,
             col.title = "black", col.axis = "black",type = c("a", "p", "confint"),
             ...)
}

## Trying to loop over the function above

for (i in length(df$chrom)){
pdf(paste0(df$chrom[i],".pdf"),width = 15, height = 13)
grid::grid.newpage()
grid::grid.text(df$chrom[i],x = (0.5), y = (0.6),gp = gpar(fontsize = 18, fontface = "bold", fontfamily="Times"))
plotGenCov(df=df,chr=df$chrom[i],list.files = list.files,regex = "_NEB.*",
           margin = 30, fontsize=10,background.panel = "#FFFEDB" , background.title="white",
           labels = c("Sample a","Sample b","Sample c","Sample d","Sample e",
                      "Sample f","Sample g","Sample h","Sample i","Sample J"),
           rotate.title=0)
dev.off()
}
Also, I am unable to plot the Ideogram track for Plasmodium Falciparum above the Genome axis track using the following code
>gen <- genome(GRanges(df))
>gen[is.na(gen)] <- "Pf"
>IdeogramTrack(genome = gen, chromosome = df$chrom[1])
Error in if (!token %in% base::ls(env)) { : the condition has length > 1

>df
          chrom start     end
1   PvP01_01_v2     1 1021664
2   PvP01_02_v2     1  956327
3   PvP01_03_v2     1  896704
4   PvP01_04_v2     1 1012024
5   PvP01_05_v2     1 1524814
6   PvP01_06_v2     1 1042791
7   PvP01_07_v2     1 1652210
8   PvP01_08_v2     1 1761288
9   PvP01_09_v2     1 2237066
10  PvP01_10_v2     1 1548844
11  PvP01_11_v2     1 2131221
12  PvP01_12_v2     1 3182763
13  PvP01_13_v2     1 2093556
14  PvP01_14_v2     1 3153402
15 PvP01_API_v2     1   29582
16 PvP01_MIT_v2     1    5989

## Also tried

> gen <- genome(GRanges(df[1,]))
> IdeogramTrack(genome = gen, chromosome = df$chrom[1])
Error in eval(expression, envir = callEnv) :
  'NA' is not a valid UCSC genome.
> gen[is.na(gen)] <- "Pf"
> IdeogramTrack(genome = gen, chromosome = df$chrom[1])
Error in eval(expression, envir = callEnv) :
  'Pf' is not a valid UCSC genome.
Feature Request: You can use above function or write a better function to make multi-sample-multi-chromosome-coverage plots. Besides, it will be really helpful to have a vignette on dealing with the non-model organism while using Gviz.
> sessionInfo( )
R version 4.2.1 (2022-06-23)
Platform: x86_64-pc-linux-gnu (64-bit)
Running under: Ubuntu 20.04.4 LTS

Matrix products: default
BLAS:   /usr/lib/x86_64-linux-gnu/blas/libblas.so.3.9.0
LAPACK: /usr/lib/x86_64-linux-gnu/lapack/liblapack.so.3.9.0

locale:
 [1] LC_CTYPE=en_US.UTF-8       LC_NUMERIC=C               LC_TIME=en_US.UTF-8
 [4] LC_COLLATE=en_US.UTF-8     LC_MONETARY=en_US.UTF-8    LC_MESSAGES=en_US.UTF-8
 [7] LC_PAPER=en_US.UTF-8       LC_NAME=C                  LC_ADDRESS=C
[10] LC_TELEPHONE=C             LC_MEASUREMENT=en_US.UTF-8 LC_IDENTIFICATION=C

attached base packages:
[1] grid      stats4    stats     graphics  grDevices utils     datasets  methods   base

other attached packages:
[1] dplyr_1.0.9          Gviz_1.40.1          GenomicRanges_1.48.0 GenomeInfoDb_1.32.2
[5] IRanges_2.30.0       S4Vectors_0.34.0     BiocGenerics_0.42.0

loaded via a namespace (and not attached):
  [1] ProtGenerics_1.28.0         bitops_1.0-7                matrixStats_0.62.0
  [4] bit64_4.0.5                 filelock_1.0.2              RColorBrewer_1.1-3
  [7] progress_1.2.2              httr_1.4.3                  backports_1.4.1
 [10] tools_4.2.1                 utf8_1.2.2                  R6_2.5.1
 [13] rpart_4.1.16                lazyeval_0.2.2              Hmisc_4.7-0
 [16] DBI_1.1.3                   colorspace_2.0-3            nnet_7.3-17
 [19] gridExtra_2.3               tidyselect_1.1.2            prettyunits_1.1.1
 [22] bit_4.0.4                   curl_4.3.2                  compiler_4.2.1
 [25] cli_3.3.0                   Biobase_2.56.0              htmlTable_2.4.0
 [28] xml2_1.3.3                  DelayedArray_0.22.0         rtracklayer_1.56.1
 [31] checkmate_2.1.0             scales_1.2.0                rappdirs_0.3.3
 [34] stringr_1.4.0               digest_0.6.29               Rsamtools_2.12.0
 [37] foreign_0.8-82              XVector_0.36.0              dichromat_2.0-0.1
 [40] htmltools_0.5.2             base64enc_0.1-3             jpeg_0.1-9
 [43] pkgconfig_2.0.3             MatrixGenerics_1.8.1        ensembldb_2.20.2
 [46] dbplyr_2.2.1                fastmap_1.1.0               BSgenome_1.64.0
 [49] htmlwidgets_1.5.4           rlang_1.0.3                 rstudioapi_0.13
 [52] RSQLite_2.2.14              BiocIO_1.6.0                generics_0.1.2
 [55] BiocParallel_1.30.3         VariantAnnotation_1.42.1    RCurl_1.98-1.7
 [58] magrittr_2.0.3              GenomeInfoDbData_1.2.8      Formula_1.2-4
 [61] interp_1.1-2                Matrix_1.4-1                Rcpp_1.0.8.3
 [64] munsell_0.5.0               fansi_1.0.3                 lifecycle_1.0.1
 [67] stringi_1.7.6               yaml_2.3.5                  SummarizedExperiment_1.26.1
 [70] zlibbioc_1.42.0             BiocFileCache_2.4.0         blob_1.2.3
 [73] parallel_4.2.1              crayon_1.5.1                deldir_1.0-6
 [76] lattice_0.20-45             Biostrings_2.64.0           splines_4.2.1
 [79] GenomicFeatures_1.48.3      hms_1.1.1                   KEGGREST_1.36.2
 [82] knitr_1.39                  pillar_1.7.0                rjson_0.2.21
 [85] codetools_0.2-18            biomaRt_2.52.0              XML_3.99-0.10
 [88] glue_1.6.2                  biovizBase_1.44.0           latticeExtra_0.6-30
 [91] data.table_1.14.2           png_0.1-7                   vctrs_0.4.1
 [94] gtable_0.3.0                purrr_0.3.4                 assertthat_0.2.1
 [97] cachem_1.0.6                ggplot2_3.3.6               xfun_0.31
[100] AnnotationFilter_1.20.0     restfulr_0.0.15             survival_3.2-13
[103] tibble_3.1.7                GenomicAlignments_1.32.0    AnnotationDbi_1.58.0
[106] memoise_2.0.1               cluster_2.1.3               ellipsis_0.3.2