
(Apologies, this got rather long ...)
I've encountered a situation where DropletUtils::emptyDrops() was calling 'too many' non-empty droplets and would appreciate some advice.
Initially, I noticed this affecting 1/60 captures in a large scRNA-seq experiment I'm analysing.
But upon investigating the issue further I'm wondering whether I should also revise how non-empty droplets are being identified in the other 59/60 captures (and more generally in other similar-ish experiments).
I found similarities to a previously reported issue ('emptyDrops behaviour when excluding mitochondrial/ribosomal genes') whereby the performance of emptyDrops(), and in particular the identification of the knee point in the barcode rank plot, was improved by excluding mitochondrial and ribosomal protein genes (this is now documented in the 'Non-empty droplets versus cells' section of the man page for emptyDrops()).
In my case, the knee point is being properly identified, but there are still too many non-empty droplets.
Another point of difference to the earlier report is that the genes driving the differences between the retained low-count barcodes and discarded barcodes in this capture are T-cell receptor (TCR) genes, which I suspect may suggest the need for assay-specific or sample-specific gene filtering.
Some details of my experiment:
- Human PBMCs profiled with 10x Genomics 5' chemistry (v2), including gene expression (GEX), a large panel (BioLegend's TotalSeq™-C Human Universal Cocktail) of antibody derived tags (ADTs), and VDJ sequencing of T-cell receptors (TCRs) and B-cell receptors (BCRs).
- 12 batches (named 3-14 for reasons), with each batch containing 5 captures, and targeting ~20,000 cells/capture.
- Within a batch, each capture is roughly a technical replicate because the cells come from the same population (a tube containing a mixture of PBMCs from different donors labelled with HTOs) which are then distributed across the 5 captures.
Initial problematic capture
The problematic capture is capture 1 of batch 13 (C120_batch13_1).
The number of non-empty droplets in this capture is 3x larger than is reasonable/expected (~65,000 rather than ~20,000 non-empty droplets from 1 lane (capture) of 10x 5' scRNA-seq data).
The other captures within this batch have similar and expected numbers of non-empty droplets.
After excluding mitochondrial, ribosomal protein, TCR, and BCR genes (hereafter referred to as gene-filtering), emptyDrops() returns a number of non-empty droplets for C120_batch13_1 that is more like what I expect (~20,000).
Interestingly, Cell Ranger (v7) reports ~20,000 cells for this capture, so presumably they do some gene-filtering before applying their implementation of the Empty Drops algorithm.
| Capture | emptyDrops() without gene-filtering |
emptyDrops() with gene-filtering |
Cell Ranger (v7) |
|---|---|---|---|
| C120_batch13_1 | 65,561 | 20,288 | 20,209 |
| C120_batch13_2 | 22,627 | 22,694 | 22,602 |
| C120_batch13_3 | 22,020 | 22,169 | 22,102 |
| C120_batch13_4 | 22,297 | 22,504 | 22,425 |
| C120_batch13_5 | 24,739 | 24,786 | 24,656 |
Following the advice in OSCA Advanced 'Testing for empty droplets' and 'emptyDrops behaviour when excluding mitochondrial/ribosomal genes', I made:
- Barcode rank plots.
- A histogram of P-values for low-total barcodes.
- MA plot comparing the retained low-count barcodes to the discarded barcodes.
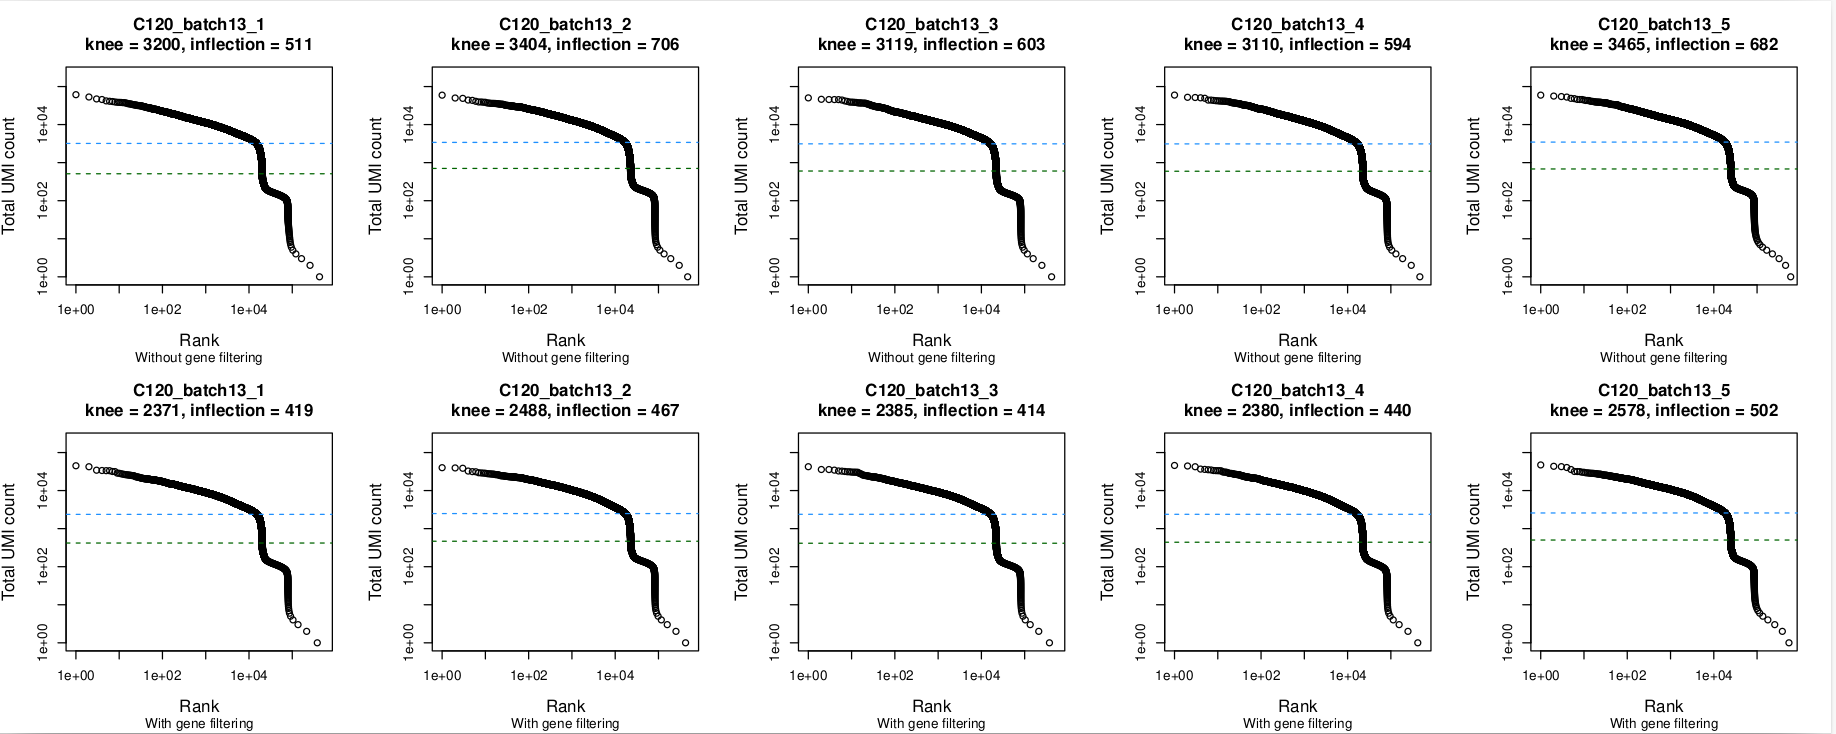
Barcode rank plots
In these plots, the top row is without gene filtering and the bottom row is after filtering out mitochondrial, ribosomal protein, TCR, and BCR genes. Nothing seems amiss in the barcode plots, with the knee being well-identified in all 5 captures. The same is true without and with gene-filtering.
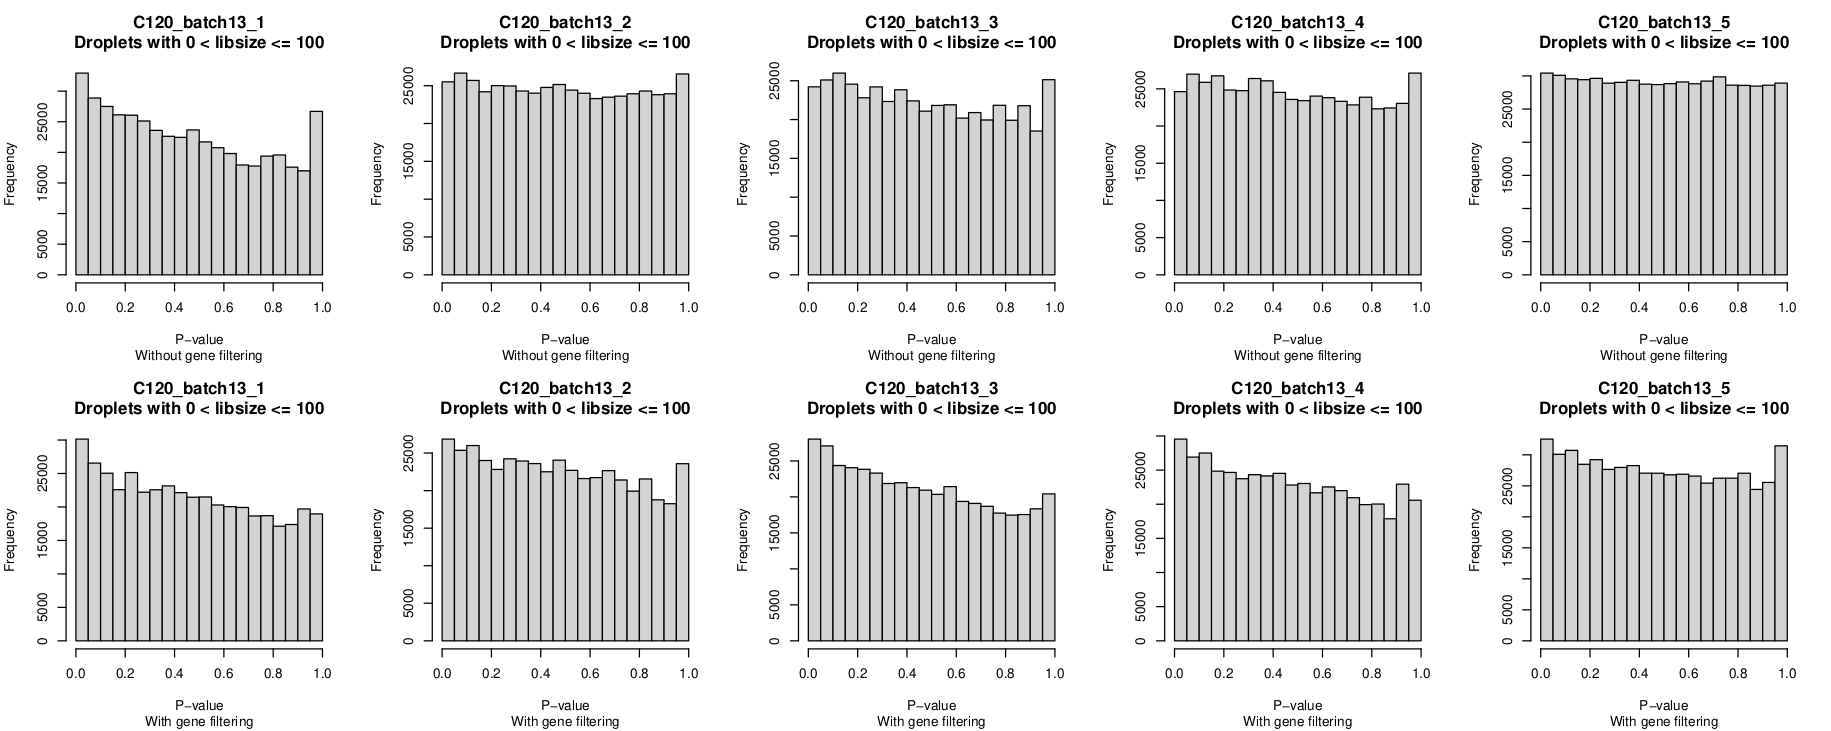
Histogram of P-values
In these plots, the top row is without gene-filtering and the bottom row is with gene-filtering.
You can clearly see the P-value distribution is not uniform for C120_batch13_1 without gene-filtering but looks reasonable-ish for the other 4 captures.
I was a little surprised that the P-value histograms are, if anything, 'worse' after gene filtering.
However, given the non-empty droplet calls look more 'reasonable' after gene filtering, I'm leaning towards overlooking this anomaly(?), although it would be good to understand why this is and if I should be more concerned by it.
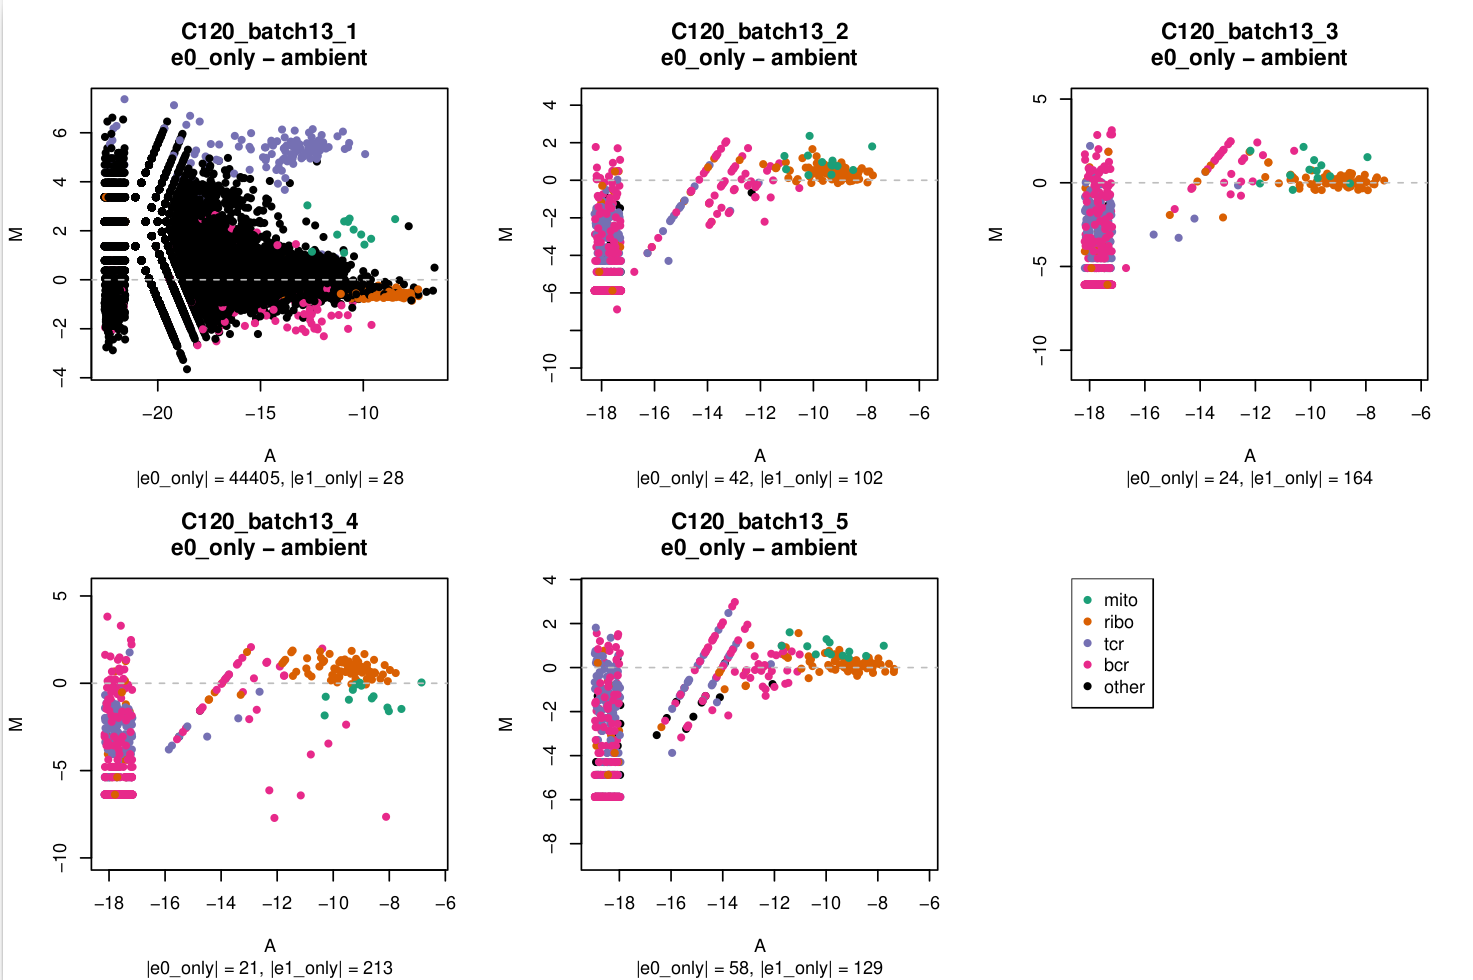
MA plot
In these plots,
e0=emptyDrops(m, test.ambient = TRUE)e1=emptyDrops(m[keep, ], test.embient = TRUE)wherekeepis a logical vector that isFALSEfor mitochondrial, ribosomal protein, TCR, and BCR genes andTRUEotherwise.
You can see in C120_batch13_1 that there's a lot of genes with large logFCs but that the TCR genes stand out.
I'm a bit miffed why this has only affected 1/5 captures in this batch and I assume that this capture is likely to be more affected by ambient RNA which I'll need to keep any eye on in downstream analysis.
In the subtitle of each plot I've reported the number of droplets exclusively identified in e0 (|e0_only|) or exclusively identified in e1 (|e1_only|) as non-empty.
Extension to other captures in this experiment
I then decided to re-run emptyDrops() on each of the 60 captures both without and with gene filtering to see if any of the other batches might be affected (I had not previously looked very closely at the emptyDrops() diagnostics because I'd obtained seemingly sensible estimates of the number of non-empty droplets).
I've uploaded PDFs of the barcode rank plots, P-value histograms, and MA plots.
A few things stand out:
- Barcode plots
- The barcode rank plots all look okay, with the knee point well-identified even when there are small 'kinks' in the plot (e.g.,
batch5,batch10). - The plots look much the same whether or not gene filtering was applied.
- The barcode rank plots all look okay, with the knee point well-identified even when there are small 'kinks' in the plot (e.g.,
- P-value histograms
- The distributions are generally quite similar within a batch.
- A non-uniform distribution, with a peak near zero, occurs more frequently than I'd expected to see (
batch3,batch4,batch5,batch8,batch9,batch10,batch13batch14) - Occasionally there are distributions with a peak near one for an almost U-shaped distribution (
batch6) - Filtering genes does not substantially change the P-value histograms. If anything, it sometimes makes it 'worse'.
- Occasionally there is within-batch variation (exemplified by
batch10_1being less uniform than other captures in that batch but also e.g.,batch7_5is perhaps less uniform than otherbatch7captures)
- MA plots
- For most captures the number of droplets exclusively identified without or with gene filtering is relatively small (<5%, being a few hundred out of ~20,000 droplets). Consequently, the pseudobulk profiles of the
e0_onlydroplets, shown in the MA plots, aren't based on very large library sizes and the MA plots are quite 'sparse'. - The MA plots are generally quite similar within a batch.
- The set of genes that are more highly expressed in the
e0_onlydroplets than in theambientdroplets, if they exist, are almost always readily identifiable asribo,tcr, orbcrenriched:ribo:batch3,batch9,tcr:batch13(specificallybatch13_1)bcr:batch3,batch5,batch6,batch10
batch13_1stands out as having a lot ofother(i.e. non-[mito|ribo|tcr|bcr]) genes that are highly expressed in thee0_onlydroplets over theambientdroplets.- The
mitogenes aren't consistent across batches, but are perhaps more often highly expressed in theambientdroplets than in thee0_onlydroplets.
- For most captures the number of droplets exclusively identified without or with gene filtering is relatively small (<5%, being a few hundred out of ~20,000 droplets). Consequently, the pseudobulk profiles of the
Conclusions and remaining questions
I'm satisfied I've found the root cause of the 'too many cells' issue for C120_batch13_1 and have a remedy by filtering out mitochondrial, ribosomal protein, TCR, and BCR genes prior to running emptyDrops().
However, I'd appreciate any thoughts on these questions that are still dogging me:
- Should I apply this gene-filtering prior to running
emptyDrops()for (1) all captures in this batch or (2) even all batches in this experiment or (3) even more broadly (e.g., all 5' datasets or all datasets that include large numbers of T cells or B cells)? - Could filtering out BCR (resp. TCR) genes from
emptyDrops()lead to B cells (resp. T cells) being marked as empty droplets? E.g., from my woeful knowledge of immunology I _think_ there are certain types of B cells where most of the gene expression is from the immunoglobulins (BCR genes). - How concerned should I be by the non-uniform P-value distributions, particularly because it's seemingly sometimes exacerbated by the gene-filtering?


I've had some further and ongoing discussion with 10x tech support. I've copied the initial reply below and will add any useful updates.
In short, for GEX+VDJ libraries Cell Ranger does additional filtering of barcodes based on the VDJ data (i.e. it's more than just their implementation of the EmptyDrops algorithm applied to the GEX data). I'm still not sure I've quite got my head around it, however, because the information in https://support.10xgenomics.com/single-cell-vdj/software/pipelines/latest/using/multi#why seems mostly to be about refining non-empty droplet calls for T and B cells. How, then, does Cell Ranger (specifically cellranger multi) estimate/identify non-empty droplets that don't contain T or B cells?
Anyway, as I pointed out in my reply, it would really help if the source code of Cell Ranger was easily browsable and publicly available, because AFAICT the source code is only available up to v3.0.2 (https://github.com/10XGenomics/cellranger).
Knowing what I do now about how Cell Ranger is applying additional and assay-specific steps for non-empty droplet detection in GEX+VDJ+ADT samples, I think I will opt to use Cell Ranger's non-empty droplet detection for these samples.
10x tech support's reply