
Hi, i'm struggling with the treeplot fuction of enrichplot. I can't obtain a treeplot where all the dots are aligned, the dot's labels are the same color of clade and there isn't 'p.adjust' in legend.
`
here the code from my script
heart_hyb_sig_down_BP_1 <- pairwise_termsim(heart_hyb_sig_down_BP)
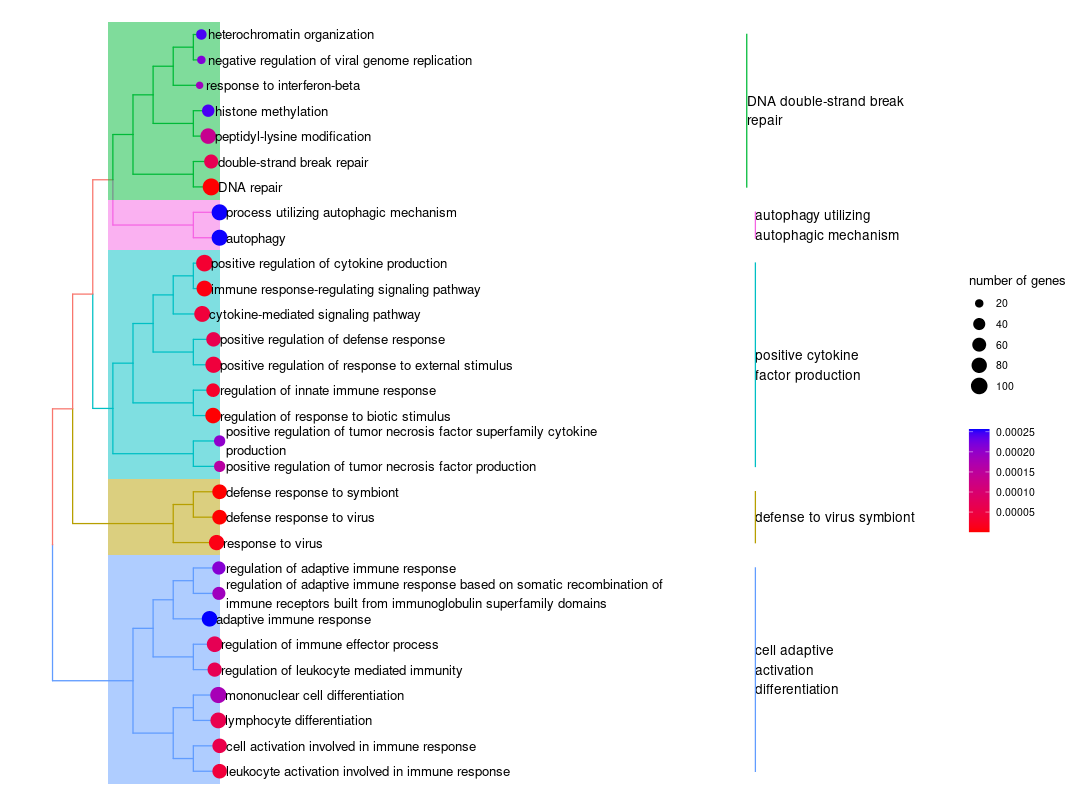
treeplot(heart_hyb_sig_down_BP_1, showCategory = 30, color = "p.adjust", offset = rel(40), fontsize = 4, hilight = T, label_format = 25, label_format_cladelab = 10, label_format_tiplab = 75, extend = 0.03, hexpand = 0.15, cex_category = 0.75 )
my info session
sessionInfo() R version 4.2.1 (2022-06-23) Platform: x86_64-pc-linux-gnu (64-bit) Running under: Ubuntu 22.04.1 LTS
Matrix products: default BLAS: /usr/lib/x86_64-linux-gnu/blas/libblas.so.3.10.0 LAPACK: /usr/lib/x86_64-linux-gnu/lapack/liblapack.so.3.10.0
locale:
1 LC_CTYPE=en_US.UTF-8 LC_NUMERIC=C LC_TIME=it_IT.UTF-8 LC_COLLATE=en_US.UTF-8 LC_MONETARY=it_IT.UTF-8
[6] LC_MESSAGES=en_US.UTF-8 LC_PAPER=it_IT.UTF-8 LC_NAME=C LC_ADDRESS=C LC_TELEPHONE=C
[11] LC_MEASUREMENT=it_IT.UTF-8 LC_IDENTIFICATION=C
attached base packages: 1 stats4 stats graphics grDevices utils datasets methods base
other attached packages:
1 ggnewscale_0.4.7 clusterProfiler_4.5.2 ggbeeswarm_0.6.0 ggrepel_0.9.1 ggplot2_3.3.6 gplots_3.1.3
[7] RColorBrewer_1.1-3 org.Rn.eg.db_3.15.0 AnnotationDbi_1.59.1 IRanges_2.31.2 S4Vectors_0.35.4 Biobase_2.57.1
[13] BiocGenerics_0.43.4 enrichplot_1.17.2 forcats_0.5.2 DOSE_3.23.2
loaded via a namespace (and not attached):
1 fgsea_1.23.2 colorspace_2.0-3 ggtree_3.5.3 gson_0.0.9 ellipsis_0.3.2
[6] qvalue_2.29.0 XVector_0.37.1 aplot_0.1.7 rstudioapi_0.14 farver_2.1.1
[11] graphlayouts_0.8.1 bit64_4.0.5 fansi_1.0.3 scatterpie_0.1.8 codetools_0.2-18
[16] splines_4.2.1 cachem_1.0.6 GOSemSim_2.23.0 polyclip_1.10-0 jsonlite_1.8.0
[21] GO.db_3.15.0 png_0.1-7 ggforce_0.3.4 compiler_4.2.1 httr_1.4.4
[26] assertthat_0.2.1 Matrix_1.5-1 fastmap_1.1.0 lazyeval_0.2.2 cli_3.4.0
[31] tweenr_2.0.2 tools_4.2.1 igraph_1.3.5 gtable_0.3.1 glue_1.6.2
[36] GenomeInfoDbData_1.2.8 reshape2_1.4.4 DO.db_2.9 dplyr_1.0.10 fastmatch_1.1-3
[41] Rcpp_1.0.9 vctrs_0.4.1 Biostrings_2.65.6 ape_5.6-2 nlme_3.1-159
[46] ggraph_2.0.6 stringr_1.4.1 lifecycle_1.0.2 gtools_3.9.3 zlibbioc_1.43.0
[51] MASS_7.3-58.1 scales_1.2.1 tidygraph_1.2.2 parallel_4.2.1 memoise_2.0.1
[56] gridExtra_2.3 ggfun_0.0.7 downloader_0.4 yulab.utils_0.0.5 stringi_1.7.8
[61] RSQLite_2.2.17 tidytree_0.4.0 caTools_1.18.2 BiocParallel_1.31.12 GenomeInfoDb_1.33.7
[66] rlang_1.0.5 pkgconfig_2.0.3 bitops_1.0-7 lattice_0.20-45 purrr_0.3.4
[71] labeling_0.4.2 treeio_1.21.2 patchwork_1.1.2 cowplot_1.1.1 shadowtext_0.1.2
[76] bit_4.0.4 tidyselect_1.1.2 plyr_1.8.7 magrittr_2.0.3 R6_2.5.1
[81] generics_0.1.3 DBI_1.1.3 pillar_1.8.1 withr_2.5.0 KEGGREST_1.37.3
[86] RCurl_1.98-1.8 tibble_3.1.8 crayon_1.5.1 KernSmooth_2.23-20 utf8_1.2.2
[91] viridis_0.6.2 grid_4.2.1 data.table_1.14.2 blob_1.2.3 digest_0.6.29
[96] tidyr_1.2.1 gridGraphics_0.5-1 munsell_0.5.0 beeswarm_0.4.0 viridisLite_0.4.1
[101] ggplotify_0.1.0 vipor_0.4.5
`
thanks for your report. It has been fixed in github version, see https://github.com/YuLab-SMU/enrichplot/pull/200.