Entering edit mode

Hello,
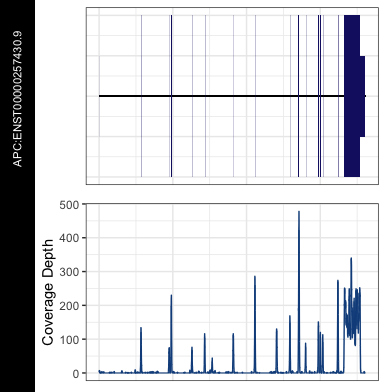
I was wondering if it is possible to add an X axis to the gene diagram with the genomic location span?
Thanks! Amy
This is what I've got so far:
genCov(x=covData, txdb=TxDbObject, gr=grObject, genome=genomeObject, cov_plotType="line", gene_isoformSel="ENST00000257430.9", base=NA, transform=NA, cov_colour="dodgerblue4", gene_colour="midnightblue", gene_name="APC:ENST00000257430.9", label_txtSize=3)