Normalizing Cut&Tag peak data
3
0
Entering edit mode
@aaed3153
Last seen 16 months ago
United States

Hello,

We are currently looking at CUT&Tag data from mice where we are comparing WT and knock-in samples and also Male vs. female using the three histone modifications K27me3, K27ac, and K4me1. We carried out peak calling using SEACR and then differential peak calling using Diffbind. Now, we want to go back to the raw peak data and just plot the normalized peak data. Can i use the dba.normalize function to normalize the raw peaks and then save it to a bed file which can be used to plot? I want to plot average profile of the peaks around the TSS region using ChipSeeker. I have used the dba.normalize function. I was just wondering how I could provide this normalized peak data to ChipSeeker so I can plot it. I don't know if this is a naive question because I went through the diffbind tutorial and couldn't find anything specific to normalizing and saving the peak file. Any help or suggestions are appreciated. Thank you so much!

Normalization Peakdata DiffBind Cut&Tag • 2.8k views
ADD COMMENT
1
Entering edit mode
Rory Stark ★ 5.2k
@rory-stark-5741
Last seen 26 days ago
Cambridge, UK

By default, dba.peakset() will return the read data using normalized counts. You can also use the writeFile parameter to write the results directly to a file.

ADD COMMENT
0
Entering edit mode
@aaed3153
Last seen 16 months ago
United States

Thank you for your reply. However, how do I retrieve normalized peaks for just the replicates? I tried this -

b<-dba.count(a,bUseSummarizeOverlaps=TRUE,summits=FALSE,bParallel=TRUE)
b<-dba.normalize(b)
c<-dba.peakset(b, bRetrieve=TRUE, writeFile = "WT_m_CTK27me3_norm.bed")

The sample sheet above contains the metadata for one pair of replicates (eg. – WT male CTK27me3). Should I continue doing this for each set of replicates. Is that right?

ADD COMMENT
1
Entering edit mode

I'm not sure exactly what you are asking when you refer to "peaks for just the replicates".

To retrieve normalized read counts for a specific subset of sample, use the peaks parameter to indicate which samples you want peak data for (either a mask or a vector of sample numbers). For example:

K27me3WT.peaks <- dba.peakset(b, peaks=b$masks$K27me3 & b$masks$WT,
                              bRetrieve=TRUE, writeFile = "WT_m_CTK27me3_norm.bed")

If you only want to merge peaks for a specific subset of samples, use the dba() function first to narrow down the samples, then count those merged peaks. For example:

K27me3WT <- dba(a,  mask=a$masks$K27me3 & a$masks$WT)
K27me3WT.counts <- dba.count(K27me3, summits=FALSE)
K27me3WT.peaks <- dba.peakset(K27me3WT.counts, bRetrieve=TRUE, writeFile = "WT_m_CTK27me3_norm.bed")

Also, you can plot peak profiles using normalized data, including profiles for merged replicates, using the dba.plotProfile()function directly.

ADD REPLY
0
Entering edit mode
@aaed3153
Last seen 16 months ago
United States

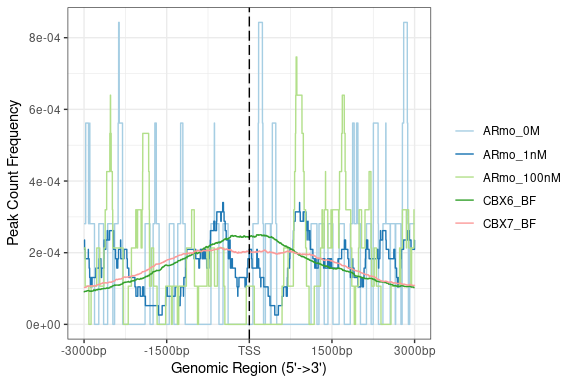
Thank you for your reply, Dr. Stark. What I mean by "peak for just the replicates" are merged normalized peaks for each set. One peak file for each set of replicates. Once I get the four peak files (WT_m_CTK27me3, WT_f_CTK27me3, KI_m_CTK27me3, KI_f_CTK27me3), I would like to plot te average peak profile using ChIPseeker like belowenter image description here

Where each line corresponds to the merged normalized peaks for each condition. I used something like this after normalizing from your previous comment for WT_m_CTK27me3 -

K27me3WT.peaks <- dba.peakset(b, peaks=b$masks$CTK27me3 & b$masks$WT & b$masks$Male, bRetrieve=TRUE, writeFile = "WT_m_CTK27me3_norm.bed

Does it make sense?

ADD COMMENT

Login before adding your answer.

Traffic: 745 users visited in the last hour
Help About
FAQ
Access RSS
API
Stats

Use of this site constitutes acceptance of our User Agreement and Privacy Policy.

Powered by the version 2.3.6