Entering edit mode

Hi Michael,
Now that I could enter my full matrix of samples and I ran LRT for each factor in my design, I would like to see in which conditions are my genes of interest being up/downregulated.
I am doing this manually by plotting specific genes using plotCounts. But sometimes I see weird outliers that were not spotted in the initial PCA for all the samples.
I am using the dds object to plot this:
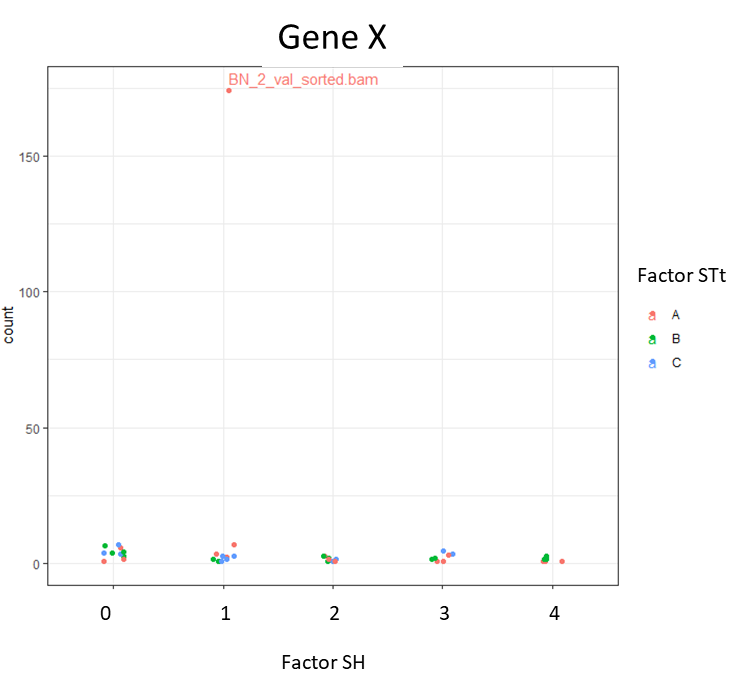
d <- plotCounts(dds, gene="GeneX", intgroup=c("FactorSH", "FactorSTt"), returnData=TRUE)

ggplot(d, aes(x = FactorSH, y = count, color = FactorSTt)) +  geom_point(position=position_jitter(w = 0.1,h = 0)) +
geom_text_repel(aes(label = rownames(d)), max.overlaps = 5) + theme_bw() + ggtitle("GeneX") +
theme(plot.title = element_text(hjust = 0.5))
If I get signif. results in the LRT test for this gene, but when I plot it I see this, should I discard that result? Or am I just missing one normalization step to visualize those counts?
Thank you.
Laia

I found out that BN is indeed an outlier (By plotting a hierarchical clustering heatmap).. so I think I'll have to remove this sample. But why wasn't this obvious in the PCAplot?
Also, I see that I have 4 samples (belonging to the same sequencing "batch4") that give lower counts in general compared to the other samples.
When I want to apply the batch correction by adding it into the model (~batch + factorSH + factorSTt + Interaction), I get an error because batches are not totally overlapping between conditions. Batches correspond to different sequencing days (samples that needed to be sequenced again after some technical issue).
So I tried a different approach: ComBat_seq, to get a new "adjusted counts_matrix". But then some clusters that were expected in the PCA (and that appeared initially) disappear after correction.
Is it possible that ComBat_seq is being too harsh? Can this be adjusted? In fact, I can only see a batch effect for batch4. Can this one be "prioritized" for correction?
Thank you.
Laia
If it is an outlier in a small number of genes, it won't be PC1 or PC2, also DESeq2 picks top genes by variance for PCA plot, you can change this in
plotPCA.We have a recommendation for correcting for batches, which is to use surrogate variables (svaseq) or "factors of unwanted variation" (RUVSeq), both of which have examples in the rnaseqGene workflow:
https://bioconductor.org/packages/release/workflows/vignettes/rnaseqGene/inst/doc/rnaseqGene.html#removing-hidden-batch-effects