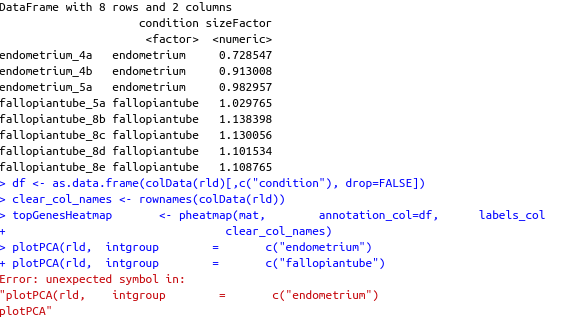
Hello, i am unsure what I am typing wrong for my code. I am trying to make a PCA plot with the data above. after typing in the code
plotPCA(rld, intgroup = c("endometrium")
I get a (+) sign. Not sure what to put for this? THANK YOU
The
# include your problematic code here with any corresponding output
# please also include the results of running the following in an R session

sessionInfo( )
Hey, it looks like you are using RStudio - not a favourite of mine due to the fact that it uses more resources (than the standard R IDE) and often interferes incorrectly with the code formatting in a predictive manner. It also makes code look less --not more-- tidy.
In this case, you simply need to add an extra parenthesis to your plotPCA() commands: