EnhancedVolcano legendPosition error
2
0
Entering edit mode
Allison • 0
@5642a4d9
Last seen 17 months ago
United States

I am using the latest EnhancedVolcano in R and having a hard time removing the legend as it is shown in the vignette, section 4.5. One of the arguments is legendPosition = 'none' and the software runs fine if I omit that line.

The last parenthesis is missing because when I carriage return to enter a custom y-axis label using ylab, I receive an error message.

Separately, does anyone know how to control the width of the plot? If I put the legend to left or right, the plot is very squished and narrow.

I'd appreciate any help. Thank you!!! **edited to add information


> head(res)
                          Gene     logFC    logCPM        F       PValue
1            gene710:MSTRG.740 -6.341201  9.567690 458.1729 1.381974e-16
2          gene1073:MSTRG.1105 -9.785021  7.724249 450.0161 4.904657e-16
3 gene4944:gene4945:MSTRG.5034 -7.936049 10.631032 407.2017 4.964511e-16
4          gene7700:MSTRG.7872 -7.460703  8.444411 397.4136 6.457303e-16
5          gene5285:MSTRG.5378 -6.651782  9.899541 421.8222 9.608796e-16
6          gene5014:MSTRG.5106 -6.870894 10.393684 377.2501 1.132143e-15
           FDR
1 1.225672e-12
2 1.348358e-12
3 1.348358e-12
4 1.348358e-12
5 1.348358e-12
6 1.348358e-12


> keyvals <- ifelse(
     + res$logFC < -2, 'blue3',
     + ifelse(res$logFC > 2, 'red2',
     + 'grey50'))
> keyvals[is.na(keyvals)]<-'grey50'
> names(keyvals)[keyvals == 'blue3'] <- 'Down-regulated'
> names(keyvals)[keyvals == 'red2'] <- 'Up-regulated'
> names(keyvals)[keyvals == 'grey50'] <- 'Not significant'


> EnhancedVolcano(res,
     + x = 'logFC',y='FDR',lab=NA,
     + legendPosition = 'none',
     + shape=c(6,2,0,16), colCustom=keyvals, colAlpha=0.9,
     + selectLab=res$Gene[which(names(keyvals) %in% c('Down-regulated','Up-regulated'))],
     + pCutoff=0.5, FCcutoff=2,
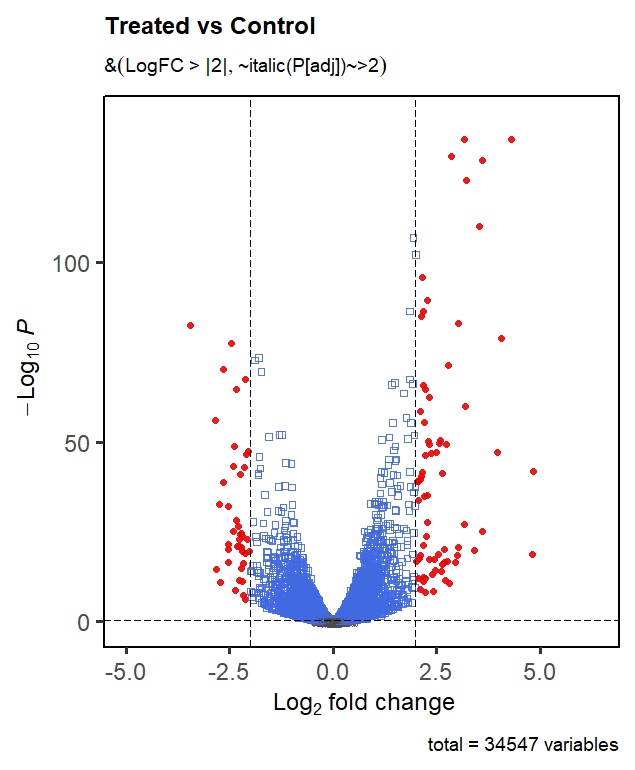
     + title = 'Treated vs Control',
     + subtitle = bquote(‘LogFC > |2| and’ ~italic(P[adj])~>0.05),
     + shape=c(6,2,0,16), colCustom=keyvals, colAlpha=0.9,
     + border='full', gridlines.minor=FALSE, gridlines.major=FALSE,
Error: unexpected symbol in:
"shape=c(6,2,0,16), colCustom=keyvals, colAlpha=0.9,
border='full"

sessionInfo( )
EnhancedVolcano • 2.0k views
ADD COMMENT
2
Entering edit mode
@elefthpavlos-21392
Last seen 4 months ago
BRFAA Athens, Greece

Hi,

First of all to be able to reproduce the error, you need to add the keyvals and TvC matrices. Running the original code from the vignette (4.5) with legendPosition = "none" works perfectly for me.

In your code you miss a parenthesis at the end to match the one opened at EnhancedVolcano( (1st line) and also line shape=c(6,2,0,16), colCustom=keyvals, colAlpha=0.9, is duplicated.

Second, you can change the dimensions using svg(filename = , width = , height = ) device or any other device (e.g. png, pdf) to save your Volcano plot to a file using your preferable dimensions.

I tried to run your code without the colCustom = keyvals and selectLab = TvC$Gene[which(names(keyvals) %in% c('Down-regulated','Up-regulated'))] using the following code:

EnhancedVolcano(res,
                x = 'log2FoldChange',
                y = 'pvalue',
                pCutoff = 0.5, 
                FCcutoff = 2,
                lab = NA,
                legendPosition = 'none',
                shape = c(6,2,0,16), 
                #colCustom = keyvals, 
                colAlpha = 0.9,
                #selectLab = TvC$Gene[which(names(keyvals) %in% c('Down-regulated','Up-regulated'))],
                title = "Treated vs Control",
                subtitle = bquote('LogFC > |2|' & "~italic(P[adj])~>2"),
                border='full', 
                gridlines.minor=FALSE, 
                gridlines.major=FALSE
)

and got the Volcano of the picture below:

enter image description here

As you can see, the argument legendPosition = "none" works here as well.

Kind regards,

Lefteris

ADD COMMENT
0
Entering edit mode

Hi, thank you for your reply! I am able to run your code and the vignette example.

In my code (which I fixed above), the issue arises when I include the colCustom and selectLab arguments alongside the legendPosition = 'none' argument. If I omit legendPosition = 'none', I am able to specify colCustom and selectLab. If I omit colCustom and selectLab, I am able to specify legendPosition = 'none'.

I'm not sure how to successfully include all 3.

Thank you for your help :) I cleaned up some other errors I found, the ones pointed out, and added a note as to why the last parenthesis is missing.

ADD REPLY
0
Entering edit mode

I fixed it! It seems that the order matters. If the custom labeling commands are passed too early, the default arguments overwrite it.

In keeping res the same:

> keyvals <- ifelse(
   + res$logFC < -2 & res$FDR < 0.05, 'blue3',
   + ifelse(res$logFC > 2 & res$FDR < 0.05, 'red2',
   + 'grey50'))
> keyvals[is.na(keyvals)]<-'grey50'
> names(keyvals)[keyvals == 'blue3'] <- 'Down-regulated'
> names(keyvals)[keyvals == 'red2'] <- 'Up-regulated'
> names(keyvals)[keyvals == 'grey50'] <- 'Not significant'

> png(filename="volcano.png")
> EnhancedVolcano(res,
   + x = 'logFC', y = 'FDR', lab = NA,
   + title = 'Treated vs. Control',
   + subtitle = bquote('Cutoff values (dashed lines) at LogFC > |2| and' ~italic(P[adj])~ '>0.05'),
   + pCutoff = 0.05, FCcutoff = 2,
   + ylab = bquote(~-Log[10]~italic(P[adj])),
   + border = 'full', gridlines.minor = FALSE, gridlines.major = FALSE,
   + selectLab = res$Gene[which(names(keyvals) %in% c('Down-regulated','Up-regulated'))],
   + colCustom = keyvals)
> dev.off()

That will result in a plot like the following:

enter image description here

Thanks so much for the help!

ADD REPLY
0
Entering edit mode
@elefthpavlos-21392
Last seen 4 months ago
BRFAA Athens, Greece

Change lab argument from NA to res$Gene and add legendPosition = "none". It should show the gene names and hide the legend. Hope it will work for you too.

Best,

Lefteris

ADD COMMENT

Login before adding your answer.

Traffic: 970 users visited in the last hour
Help About
FAQ
Access RSS
API
Stats

Use of this site constitutes acceptance of our User Agreement and Privacy Policy.

Powered by the version 2.3.6