I am using the latest EnhancedVolcano in R and having a hard time removing the legend as it is shown in the vignette, section 4.5. One of the arguments is legendPosition = 'none' and the software runs fine if I omit that line.
The last parenthesis is missing because when I carriage return to enter a custom y-axis label using ylab, I receive an error message.
Separately, does anyone know how to control the width of the plot? If I put the legend to left or right, the plot is very squished and narrow.
I'd appreciate any help. Thank you!!! **edited to add information
> head(res)
                          Gene     logFC    logCPM        F       PValue
1            gene710:MSTRG.740 -6.341201  9.567690 458.1729 1.381974e-16
2          gene1073:MSTRG.1105 -9.785021  7.724249 450.0161 4.904657e-16
3 gene4944:gene4945:MSTRG.5034 -7.936049 10.631032 407.2017 4.964511e-16
4          gene7700:MSTRG.7872 -7.460703  8.444411 397.4136 6.457303e-16
5          gene5285:MSTRG.5378 -6.651782  9.899541 421.8222 9.608796e-16
6          gene5014:MSTRG.5106 -6.870894 10.393684 377.2501 1.132143e-15
           FDR
1 1.225672e-12
2 1.348358e-12
3 1.348358e-12
4 1.348358e-12
5 1.348358e-12
6 1.348358e-12


> keyvals <- ifelse(
     + res$logFC < -2, 'blue3',
     + ifelse(res$logFC > 2, 'red2',
     + 'grey50'))
> keyvals[is.na(keyvals)]<-'grey50'
> names(keyvals)[keyvals == 'blue3'] <- 'Down-regulated'
> names(keyvals)[keyvals == 'red2'] <- 'Up-regulated'
> names(keyvals)[keyvals == 'grey50'] <- 'Not significant'


> EnhancedVolcano(res,
     + x = 'logFC',y='FDR',lab=NA,
     + legendPosition = 'none',
     + shape=c(6,2,0,16), colCustom=keyvals, colAlpha=0.9,
     + selectLab=res$Gene[which(names(keyvals) %in% c('Down-regulated','Up-regulated'))],
     + pCutoff=0.5, FCcutoff=2,
     + title = 'Treated vs Control',
     + subtitle = bquote(‘LogFC > |2| and’ ~italic(P[adj])~>0.05),
     + shape=c(6,2,0,16), colCustom=keyvals, colAlpha=0.9,
     + border='full', gridlines.minor=FALSE, gridlines.major=FALSE,
Error: unexpected symbol in:
"shape=c(6,2,0,16), colCustom=keyvals, colAlpha=0.9,
border='full"

sessionInfo( )


Hi, thank you for your reply! I am able to run your code and the vignette example.
In my code (which I fixed above), the issue arises when I include the
colCustomandselectLabarguments alongside thelegendPosition = 'none'argument. If I omitlegendPosition = 'none', I am able to specifycolCustomandselectLab. If I omitcolCustomandselectLab, I am able to specifylegendPosition = 'none'.I'm not sure how to successfully include all 3.
Thank you for your help :) I cleaned up some other errors I found, the ones pointed out, and added a note as to why the last parenthesis is missing.
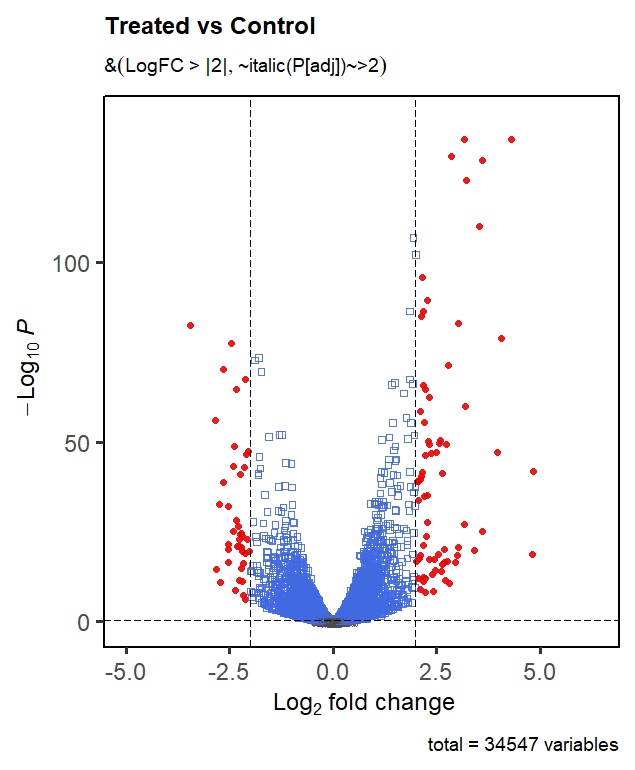
I fixed it! It seems that the order matters. If the custom labeling commands are passed too early, the default arguments overwrite it.
In keeping
resthe same:That will result in a plot like the following:
Thanks so much for the help!