Dear all,
I am analyzing two independent miRNA expression datasets from Agilent platforms, GSE95855 and GSE208159. I used the Series Matrix File that contained the normalized expression values. However, I got too many differential expressed miRNA, (about 80% of total miRNAs). Since it is my first experience to analyze such a data, could you please take a look at my codes and kindly tell me what's wrong?
> x <- read.table("gse95855.txt", sep="\t", header=TRUE, stringsAsFactors = FALSE, fill=TRUE)
> x <- data.matrix(x[,2:ncol(x)])
> rownames(x) <- probes
> head(x[,1:3])
                GSM2527071 GSM2527072 GSM2527073
rno-let-7a-1-3p  -3.283962  -3.273210  -3.253303
rno-let-7a-5p     9.756434   9.567634   9.756434
rno-let-7b-3p    -3.283962  -3.273210  -3.253303
rno-let-7b-5p    11.074507  11.074507  11.074507
rno-let-7c-1-3p  -3.283962  -3.273210  -3.253303
rno-let-7c-5p    10.604004  10.604004  10.604004

> x <- na.omit(x)
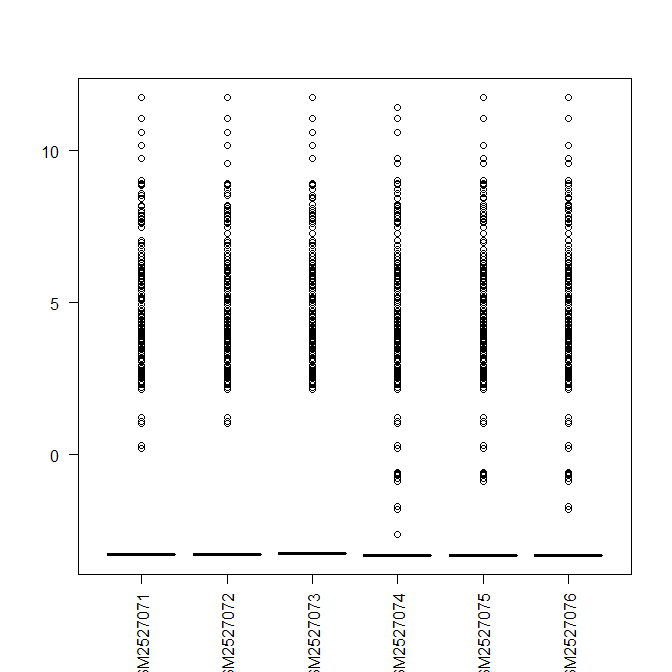
> boxplot(x, las=2)
> targets <- read.table("targets.txt", header=TRUE, sep="\t")
# DE analysis
> group <- factor(targets$group, levels=c("control","Mi"))
> design <- model.matrix(~group)
> colnames(design) <- c("control","Mivscontrol")
> design
  control Mivscontrol
1       1           0
2       1           0
3       1           0
4       1           1
5       1           1
6       1           1
attr(,"assign")
[1] 0 1
attr(,"contrasts")
attr(,"contrasts")$group
[1] "contr.treatment"

> fit <- lmFit(x,design)
> fit <- eBayes(fit,trend=TRUE,robust=TRUE)
> topTable(fit,coef=2)

> summary(decideTests(fit,method = "global"))
       control Mivscontrol
Down       640         643
NotSig      22          84
Up          96          31
Also, 
Many thanks for your advice


Have you looked at logFC ? In the original paper they took fold change ≥ 2.0 and a P value ≤ 0.1