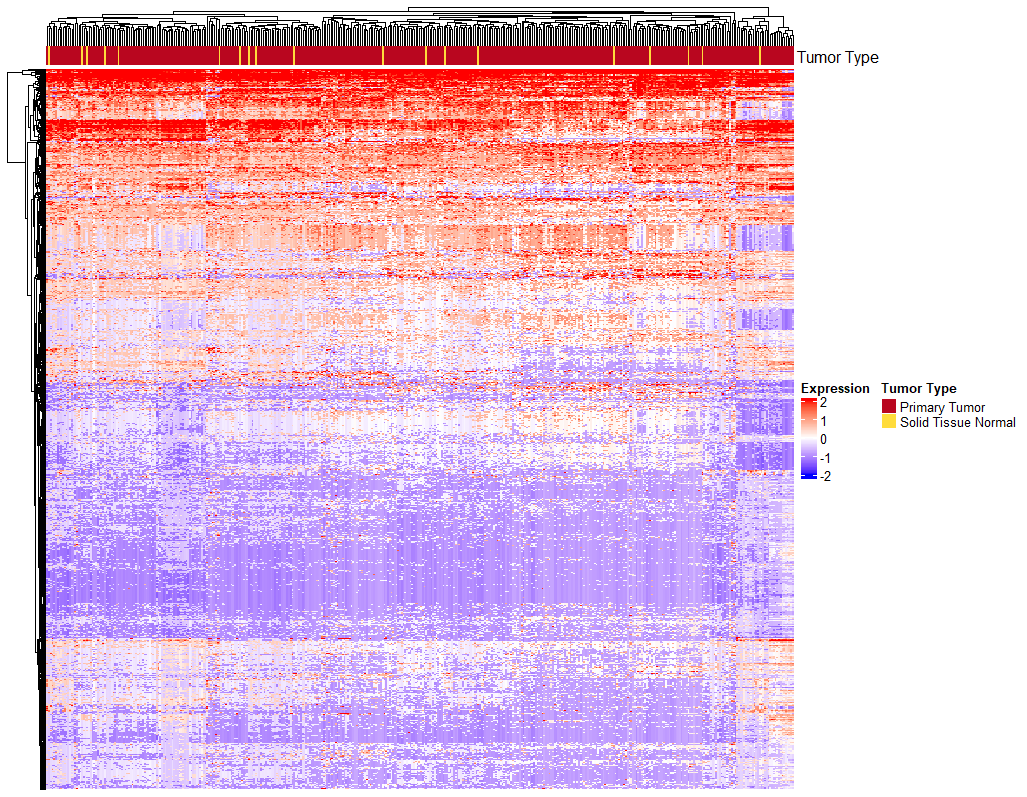
I drew a heatmap using 'ComplexHeatmap' package. I want to draw barplots grouped by 'Tumor Type'.
Here is my code.
ha1 <- HeatmapAnnotation("Tumor Type" = pheno.df$sample_type.samples,
                     col = list("Tumor Type" = c("Primary Tumor" = "#B9061F",
                                                 "Solid Tissue Normal" = "#FFDC3C")))

Heatmap(mat_scaled, name = "Expression", col = colorRamp2(c(-2, 0, 2), c("blue", "white", "red")),
    cluster_columns = T, show_column_names = F, show_row_names = F, cluster_rows = T,
    top_annotation = ha1)
And here is my heatmap.
How can I solve this problem?


Can you explain what you mean by 'barplots grouped by tumor type'? Are you saying you want the columns of the heatmap ordered to keep the tumor types together, or do you want to add a barplot as an annotation for the columns?
I want the columns of the heatmap ordered to keep the tumor types together.