Entering edit mode

Hi.
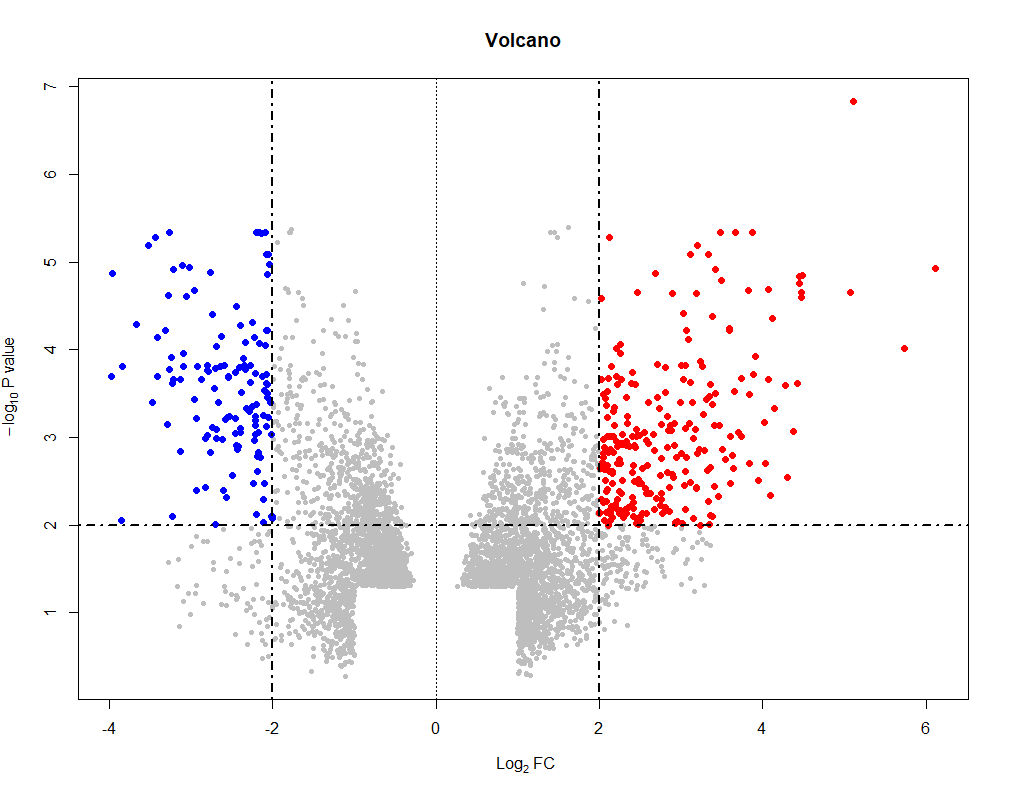
I have a question about volcano plot.
I drew a volcano plot in R, but part of the volcano plot dose not appear.
Here is my volcano plot and the code.
with(topT, plot(logFC, -log10(adj.P.Val), pch = 20, main = "Volcano", col = "grey",
                cex = 1.0, xlab = bquote(~ Log[2] ~ FC),
                ylab = bquote(~ -log[10] ~ P ~ value)))
with(subset(topT, adj.P.Val < cut_pvalue & logFC > cut_logFC),
     points(logFC, -log10(adj.P.Val), pch = 20, col = 'red', cex = 1.5))
with(subset(topT, adj.P.Val < cut_pvalue & logFC < (-cut_logFC)),
     points(logFC, -log10(adj.P.Val), pch = 20, col = 'blue', cex = 1.5))
abline(v = 0, col = 'black', lty = 3, lwd = 1.0)
abline(v = -cut_logFC, col = 'black', lty = 4, lwd = 2.0)
abline(v = cut_logFC, col = 'black', lty = 4, lwd = 2.0)
abline(h = -log10(max(topT$adj.P.Val[topT$adj.P.Val < cut_pvalue], na.rm=TRUE)),
       col = 'black', lty = 4, lwd = 2.0)
The bottom part of the volcano plot does not appear. How can I solve this problem?
There is no error in this code, you need to provide the complete code leading to this issue, in addition to a small dataset example