Entering edit mode

Hi,
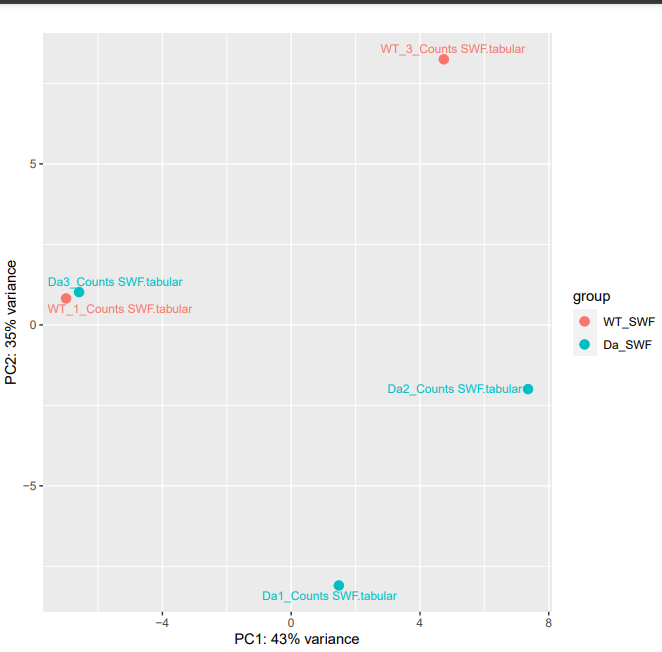
I am new to RNA-Seq analysis so apologies in advance if anything is not clear. I want to compare the gene expression of a mutant (knockout) strain with a wild-type strain. I have 3 replicates for my mutant (Da) and 2 for my wild-type strain (WT). As you can see in the image below, after running DESeq2 on galaxy I obtain the following PCA plot. Three things concern me are:
- One of my Da and one of my WT replicates are grouped together.
- One on WT replicates is on the line with the other 2 Da replicates.
- There's high intragroup variability. How would you proceed with these data? Should I exclude Da3 and WT3 from my analysis? Thank you!

I am not sure which sort of answer you expect as it's not a technical problem with the package. n=3 is not much to identify outliers because either than one point or the other two could be outliers. Not enough samples to tell. Try both, so keeping everything and removing that one point and see what works better in terms of getting more DEGs. There is no 'right' answer to this. Check whether a batch effect (time of making the libraries for example) could explain separation, see vignette for diagnostics.