Entering edit mode

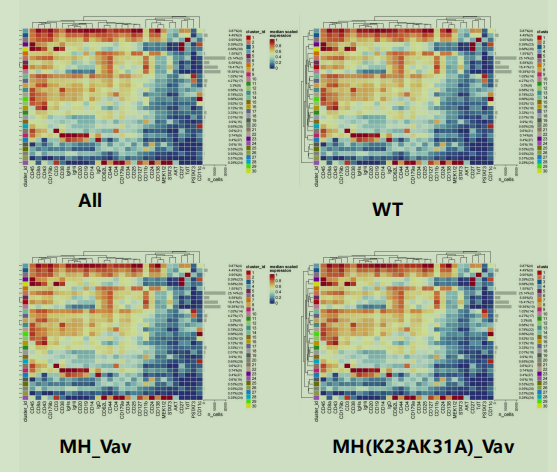
Hi, I want to use the plotExprHeatmap function to draw heat maps according to groups,as shown in the figure,
but I can't achieve it.
plotExprHeatmap(sce, features = "type",
                by = "cluster_id", k = "meta30",
                row_clust = F,
                bars = TRUE, perc = TRUE)
This method can only draw heat maps of all groups.
I try to extract sce with subset, but it will reduce the number of antibodies, which is obviously unscientific
sce1 <- subset(sce,levels(sce@colData$group)=="WT")
In addition, I have tried the following methods:
colData1 <- sce@colData[which(sce@colData$group=="WT"),]
colData<- sce@colData
sce1 <- sce
sce1@colData <- colData1

sce1@assays@data$counts <-sce1@assays@data$counts[,164769]
sce1@assays@data$exprs <-sce1@assays@data$exprs[,164769]
But an error occurred:
> plotExprHeatmap(sce1, features = "type",
+                 by = "cluster_id", k = "meta30",
+                 row_clust = F,
+                 bars = TRUE, perc = TRUE)
Error in validObject(result) :
  invalid class “SingleCellExperiment” object:
    'x@assays' is not parallel to 'x'
Is there any way to achieve my goal? Thank you!
Generally, I'd highly recommend against
@for anything, but instead using the designatedSingleCellExperimentaccessor and replacement methods.Also, you want to filter the SCE, not the cell metadata (
colData). The class is designed to keep everything in synch (i.e., assays, feature- and observation-metadata). So by subsetting the object, there is no need to also adjust other slots manually.Finally, note that
CATALYSThas a function specifically for filtering (while this can be done using basic commands, it also assures that internal metadata and factor levels etc. are corrected under the hood)...This should do the trick:
Wow, that's great! Thank you!