How many parameters should be included in the model design for deseq2?
2
1
Entering edit mode
Weiqian ▴ 10
@912d91f3
Last seen 8 days ago
United States

Hi Michael, I am using deseq2 to perform DE analysis over ~100 human postmortem brain tissues, our major interest is finding DEGs between AD and ctrl, meanwhile we also have other covariates such as different brain regions, sexes, age, batch, and RIN (RNA integrity number). Previously I applied PCA analysis to help decide which covariates should be included in the model: design(ddssva)<- ~ SV1+SV2+Area+Sex+Sequence_Batch+Age+Group, and that did give me DEGs between AD and ctrl with functional enrichment validated as expected. But now I am a bit confused about whether the 'perfect' model design is necessary after I saw figure 2 in this paper: https://www.biologicalpsychiatryjournal.com/article/S0006-3223(20)31674-7/fulltext#secsectitle0015 According to this result from GTEx dataset, a bunch of sequencing-related technical factors appear as top drivers of expression variance for gene count matrix, which means a better model should include these technical factors as well, and that can lead to over 10 more paramters in the deseq2 model. So I have 2 questions relating to this topic:

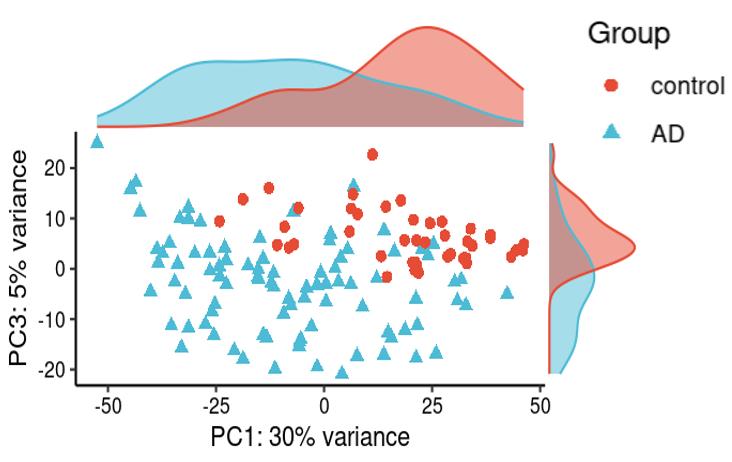
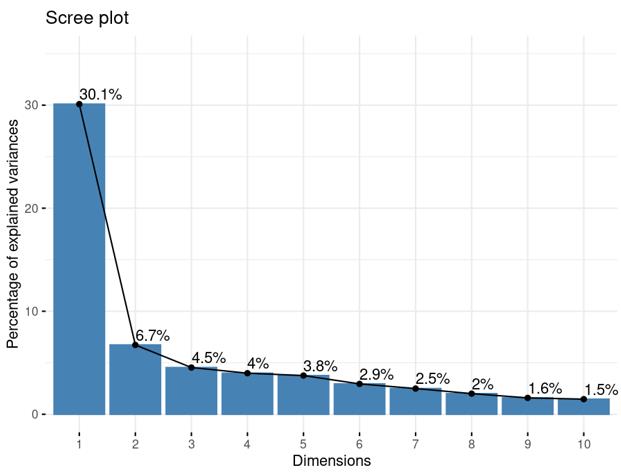
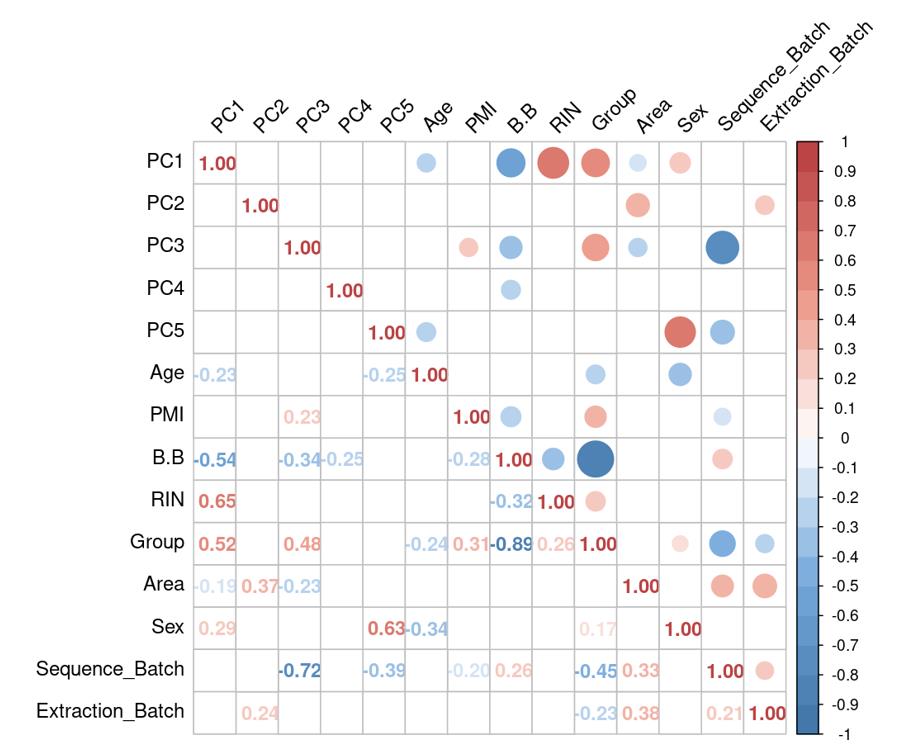
  1. Is it reasonable to include as many covariates as possible, if those covariates are considered important judging from a top PCA plot (attached picture 1) or from the percentage of variance explained? Because on the one hand, I guess too many paramters can cause an overfitting problem; On the other hand, even if we include all those covariates, whether from the metadata sheet or sequencing fastqc report at our hand, there is still a large proportion of residual variance as you could see from figure 2 in the linked article. The similar problem also happens if we look at the PCA analysis, ideally we can have top N PCs able to explain >85% variance for the gene count matrix (in fact in some cases top N PCs can only explain some proportion of variance - attached picture 2, although we still see our expected case-ctrl signal is already there), but a correlation map (attached picture 3) between variables and top PCs shows that each variable is just strongly/weakly correlated with top N PCs. So if we use those variables in our deseq2 model, we are also not able to explain >85% variance since these variables are just partly correlated with top N PCs. This made me very confusing, is it necessary and possible to achieve a 'perfect' model design? Even though this 'perfect' model isn't perfect at all since gene count matrix has too much noise. In other words, besides the variables of interest, is there any criterion I can refer to choose which other covariates to include in the model to make my model more accurate?

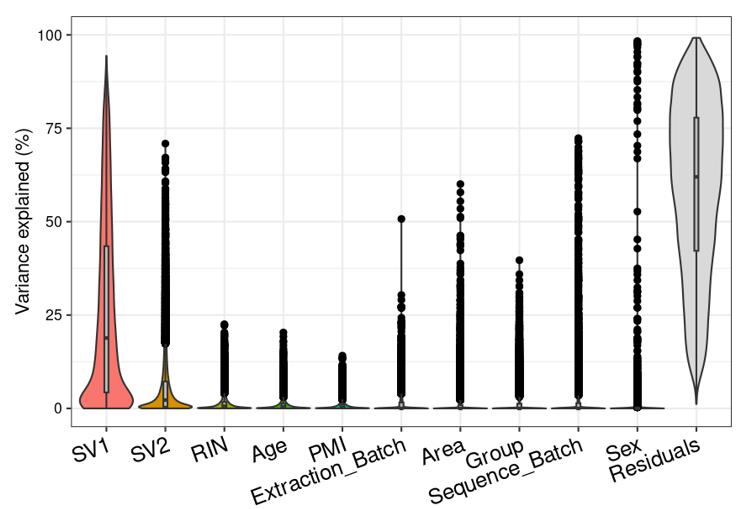
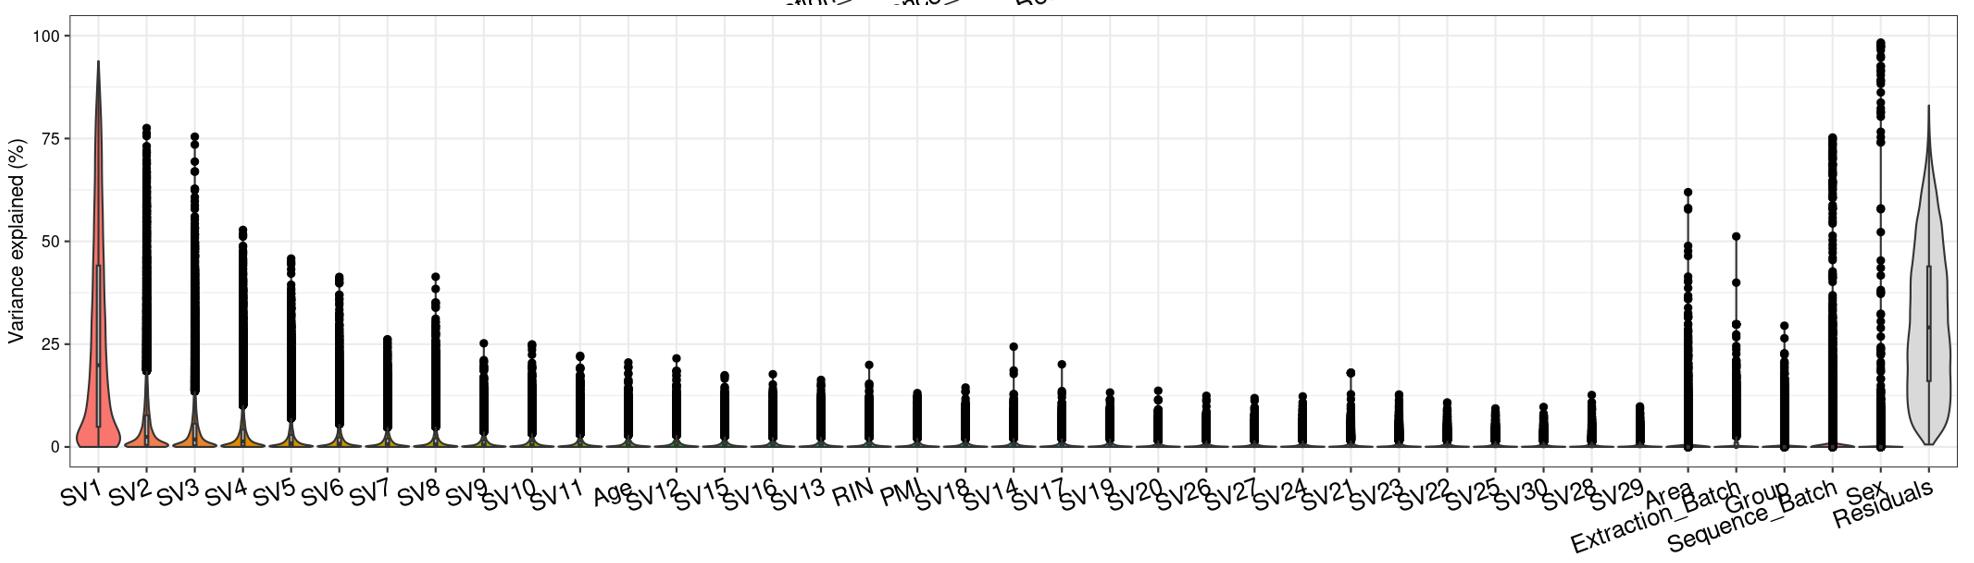
  2. Question 2 is a extended thought of question 1, I tried using SVA (surrogate variable analysis from Rpackage: 'sva') to account for the residual influence of my current model design: design(ddssva)<- ~ SV1+SV2+Area+Sex+Sequence_Batch+Age+Group, but the same confusion happens again: how many surrogate variables should be included... Choosing top 2 SVs can give 60% residual variance (attached picture 4, variance is computed by a linear-mixed model from Rpackage: 'variancePartition', violin plot shows variance explained by each variable across all genes), while choosing top 30 SVs can give 30% residual variance (attached picture 5). But is it OK or needed that I include 30 more SVs into deseq2 model?

I really appreciate any helpful thought and ideas! Thanks a lot!

picture 1 picture 2 picture 3 picture 4 picture 5

DESeq2 variancePartition • 1.5k views
ADD COMMENT
0
Entering edit mode

I'm not free this week but will try to return to this on Monday

ADD REPLY
0
Entering edit mode
@gabrielhoffman-8391
Last seen 12 days ago
United States

There is no perfect way of doing this. But the goal is to identify important biological and technical confounding variables that you want to account for in the regression model. However, including PC's or SV's for differential expression analysis is problematic since it captures true biological expression variation and can absorb some of the true biological signal. It is common to include these in QTL analysis, but it is problematic for differential expression. Based on this, you should include variables like RIN, Sex, Age, etc that may be confounding for the AD vs control comparison. This only uses up a few degrees of freedom. DESeq2 is a great tool for this analysis.

In my work, we often see a lot of batch-to-batch technical variation. With many batches, including them as a fixed effect, as in DESeq2 or limma, can be problematic since it uses many degrees of freedom. Instead, variancePartition::dream() can model these batches using a random effect in a precision-weighted linear mixed model. This can increase power while still controlling the false positive rate.

In general, for n samples, using more than \sqrt(n) degrees of freedom (i.e. continuous variables + # categories for discrete variables) is problematic. If you are well below this number, then DESeq2 is good. If you have many batches, you can model it is a random effect with dream().

ADD COMMENT
0
Entering edit mode

Hi Gabriel, thanks a lot for your answer. Actually I am just using variables like RIN, sex, case-ctrl in deseq2 model design (no PCs used), and we also used top SVs to account for the remaining unknown influence that might come from different cell type composition for example .

My question is that since the paper mentioned above found so many parameters can explain the variance within gene count matrix, is it suitable that we take all these variables including upstream qc metrics into deseq2 model?

My argument is doing this can potentially cause overfitting or decrease of power for deseq2, moreover, doing this still leaves a very large percentage of residual variance. I think we'd agree a gene count matrix is very noisy, with some signal of interest embedded, and no model can perfectly explain all the variance source. Let's say an ideally perfect model can achieve 100% variance explained (score 100), while a realistic model we can have (limited by the metadata information we can collect from each sample) is score 30, is it helpful that we increase this to score 50 with the risk of increasing more and more variables in the model design? And why is score 50 acceptable rather than 30 as they both are not getting score 100, just because this is already all the information we can collect and put into the model? I'm getting confused of where the boundary lies when deciding how many variables we should put into the model...

One more note from my own project for AD disease Vs ctrl study, model 1 looks like this: ~ Case_ctrl, model 2 looks like this: ~ Case_ctrl + sex + brain_region. I found the DEGs between AD Vs ctrl are largely overlapping between these two models, and GO enrichment analysis further validates that the true signal of AD disease influence is always there, larger or a bit smaller. But you could say model 2 should be better than model 1 because it captures more variance sources (sex and brain_region parameter are validated as important by PCA analysis as well as VPA analysis), but is that really helpful? And you would guess another model 3 can be even better than model 2 by including more and more variables, however it seems not beneficial to find more true signal between AD Vs ctrl.

ADD REPLY
0
Entering edit mode
@mikelove
Last seen 14 hours ago
United States

I like Gabriel's answer above.

I will also say that we use RUV (similar to SVA) a lot, and we guide our analysis by lots of diagnostic plots. The RUV papers are a good place to start, regarding what kinds of plots to look at, to help determine the rank of the controlling variables to use. RUV is a set of methods, which can take advantage of designs for large cohorts, including technical replicates if you have them. When we use RUV, we make sure it is not removing variation that is in the same direction as the condition (so it's not simply PCs of the expression matrix as that could remove true DE).

ADD COMMENT
0
Entering edit mode

Thanks Michael, I would look for the RUV papers to read.

ADD REPLY

Login before adding your answer.

Traffic: 433 users visited in the last hour
Help About
FAQ
Access RSS
API
Stats

Use of this site constitutes acceptance of our User Agreement and Privacy Policy.

Powered by the version 2.3.6