
I've run DMLtest to test differential methylation between two samples. Since there are no replicates I used smoothing=TRUE. Some of the results don't make sense to me. Below is an example.
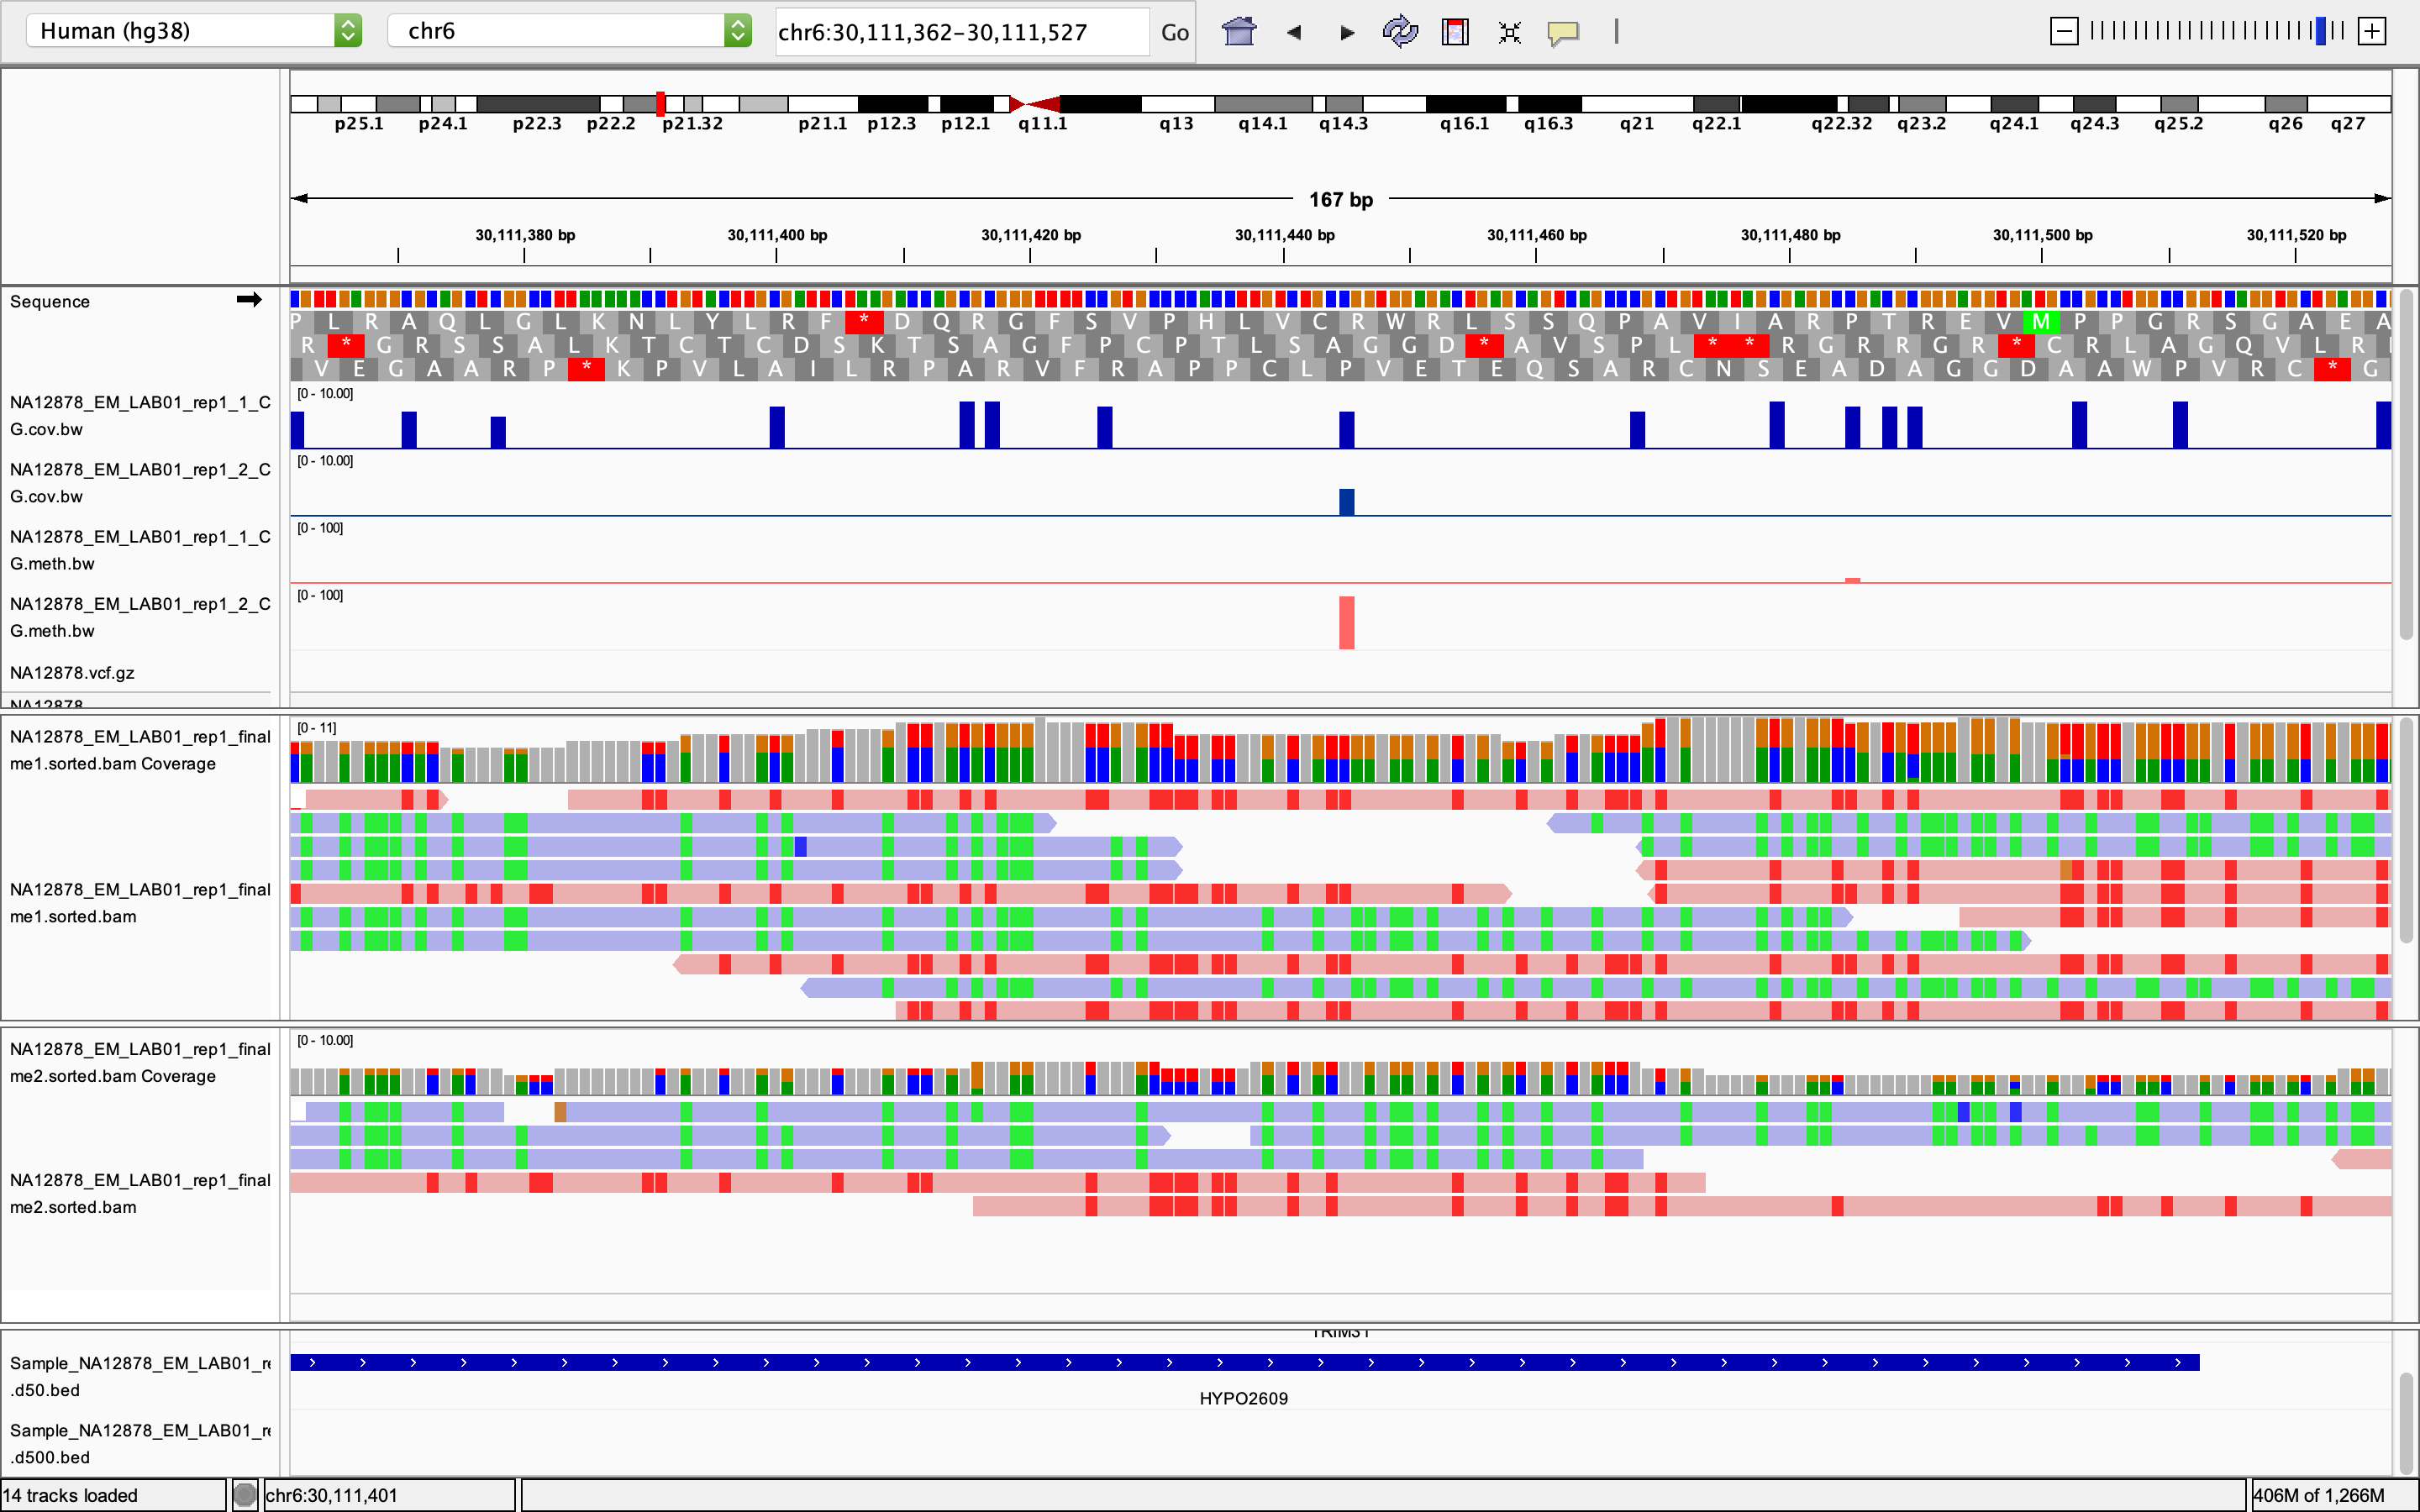
Below is a region that was called as a DMR from callDMR. There are 16 CpGs in this region (the 16 bars in the first track). Only the CpG at 30111445 has coverage in both samples (as shown in the top two tracks). And this CpG is fully unmethylated in sample 1 (all 7 reads are unmethylated) and fully methylated in sample 2 (all 5 reads are methylated).
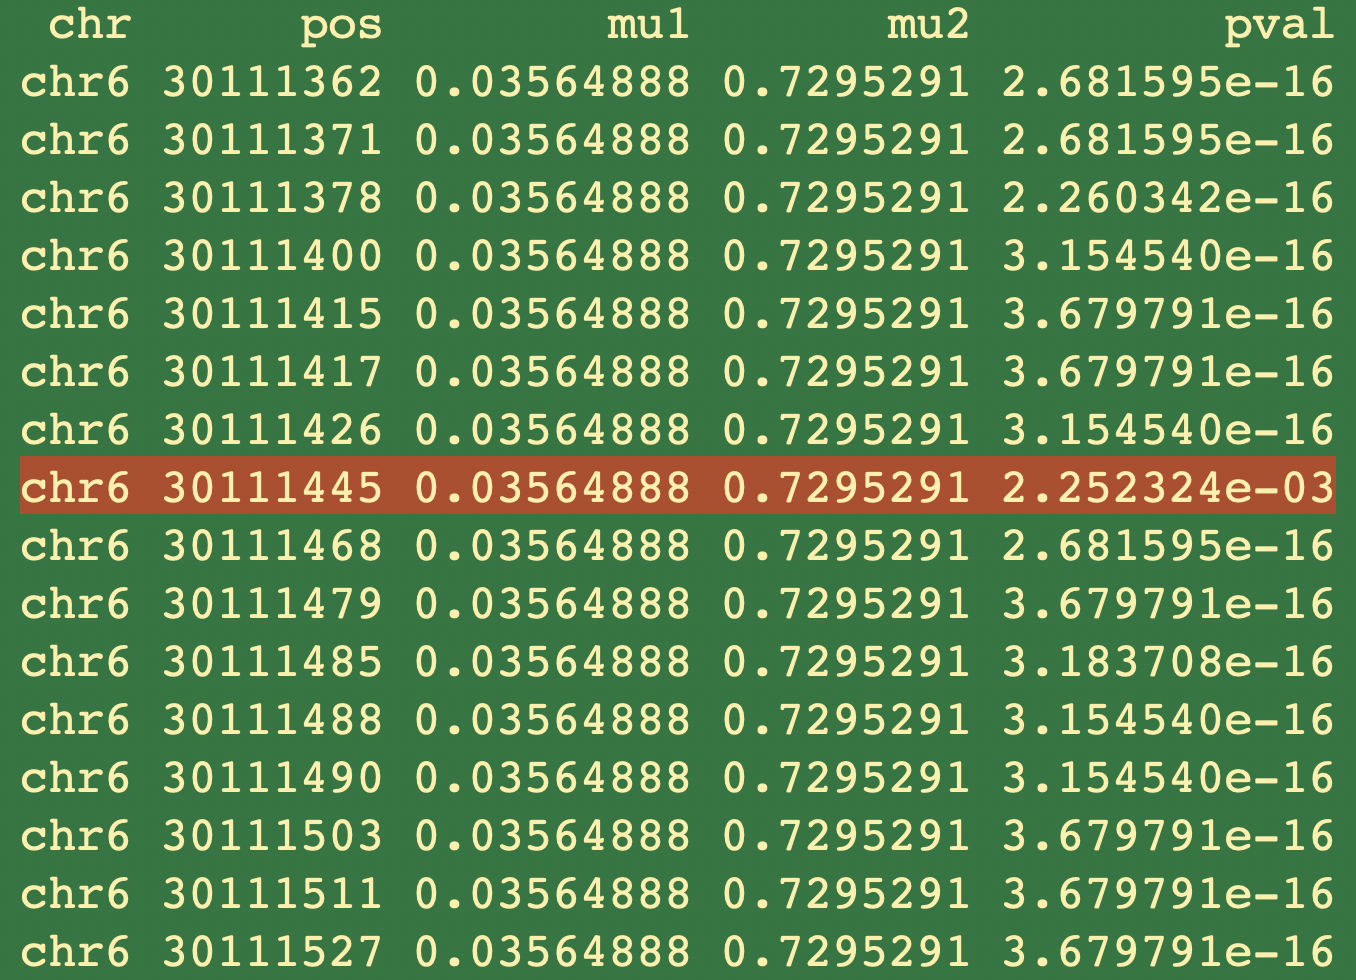
Below is the output from DMLtest. All 16 CpGs have identical mu1 and mu2 values. The CpG at 30111445 (the only CpG that is covered in both samples) has a p-value = 2.252324e-03, and all the other CpGs got very low p-values, even though they don't have read coverage in the 2nd sample at all. So by using the default p-value cutoff, the true CpG that is differentially methylated is discarded, while all the remaining 15 CpGs that do not have coverage in one sample are kept as DMLs.
I'm really confused by these results:
- Why does DSS do test on CpGs that have no coverage at all in one sample and how does it make up the values from nothing?
- The only CpG that is covered in both samples in this region has 0% methylation in sample 1 and 100% methylated in sample2. Why does DSS change this to 0.03564888 versus 0.7295291?
I guess both actions are a result of smoothing, but I think this twists the real data too much. Is there a way to avoid this behavior? Should I first filter out the CpGs that have coverage only from one sample and then run DSS? But I've read that coverage filtering is not recommended because it's taken care of in DSS.
Thanks in advance for any explanation & advice.
Code:
library(DSS)
bs_data <- list()
bs_data[['hap1']] <- read.table('NA12878_EM_LAB01_rep1_1_CpG.bedGraph', skip=1)
bs_data[['hap2']] <- read.table('NA12878_EM_LAB01_rep1_2_CpG.bedGraph', skip=1)

for (i in names(bs_data)) {
    dd <- bs_data[[i]]
    dd$chr <- dd[,1]
    dd$pos <- dd[,2] + 1
    dd$N <- dd[,5] + dd[,6]
    dd$X <- dd[,5]
    bs_data[[i]] <- subset(dd, select=c(chr, pos, N, X))}

BSobj = makeBSseqData(list(bs_data[[1]], bs_data[[2]]), c("hap1", "hap2") )
dmlTest.sm = DMLtest(BSobj, group1=c("hap1"), group2=c("hap2"), smoothing=TRUE)
dmls = callDML(dmlTest.sm, p.threshold=0.001)
dmrs = callDMR(dmlTest.sm, p.threshold=0.001, minlen=100, minCG=15, dis.merge=100, pct.sig=0.5, delta=0)

> sessionInfo()
R version 4.2.2 (2022-10-31)
Platform: x86_64-conda-linux-gnu (64-bit)
Running under: Debian GNU/Linux 10 (buster)

Matrix products: default
BLAS/LAPACK: /usr/local/lib/libopenblasp-r0.3.21.so

locale:
[1] C

attached base packages:
[1] parallel  stats4    stats     graphics  grDevices utils     datasets
[8] methods   base

other attached packages:
 [1] DSS_2.46.0                  bsseq_1.34.0
 [3] SummarizedExperiment_1.28.0 MatrixGenerics_1.10.0
 [5] matrixStats_0.62.0          GenomicRanges_1.50.0
 [7] GenomeInfoDb_1.34.1         IRanges_2.32.0
 [9] S4Vectors_0.36.0            BiocParallel_1.32.0
[11] Biobase_2.58.0              BiocGenerics_0.44.0